Ready to Move On?
If you’re doing the Sensor Starters in order, your next stop is the Sound sensor! Good luck and have fun!

The Ultraviolet Light sensor on board databot™ is the VEML6075 manufactured by Vishay Semiconductor. This gnarly little sensor incorporates photodiode, amplifiers, and analog/digital circuits into a single chip able to detect UVA and UVB wavelengths to calculate the UV Index.
This sensor is used in a variety of devices such as wearables (smart watches & smart bands), in hand-held UV meters, medical equipment, weather stations, smart devices and more. If you’re out running in the sun, this sensor can warn you if the UV index is dangerously high and you need to seek cover!
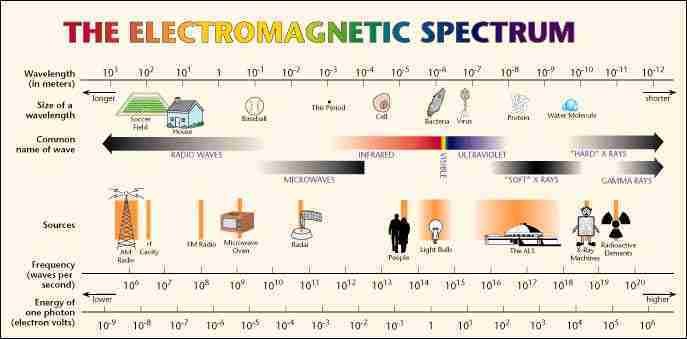
 Ultraviolet light is broken down into three categories based on their wavelength:
 The Ultraviolet Index (UVI) is calculated from the intensity levels of UV A and UV B and is a published value used by government and public service agencies to alert the general population to potentially dangerous levels of UV that may be occurring.
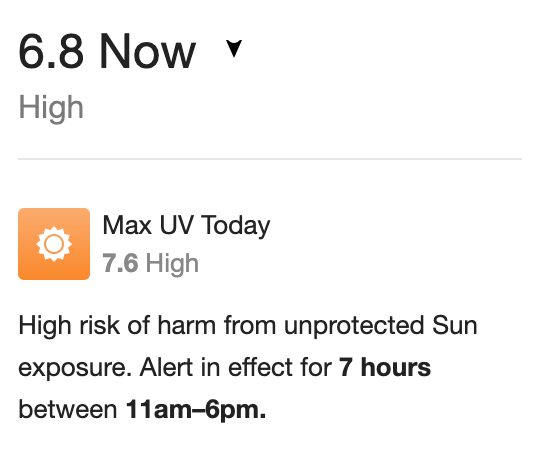
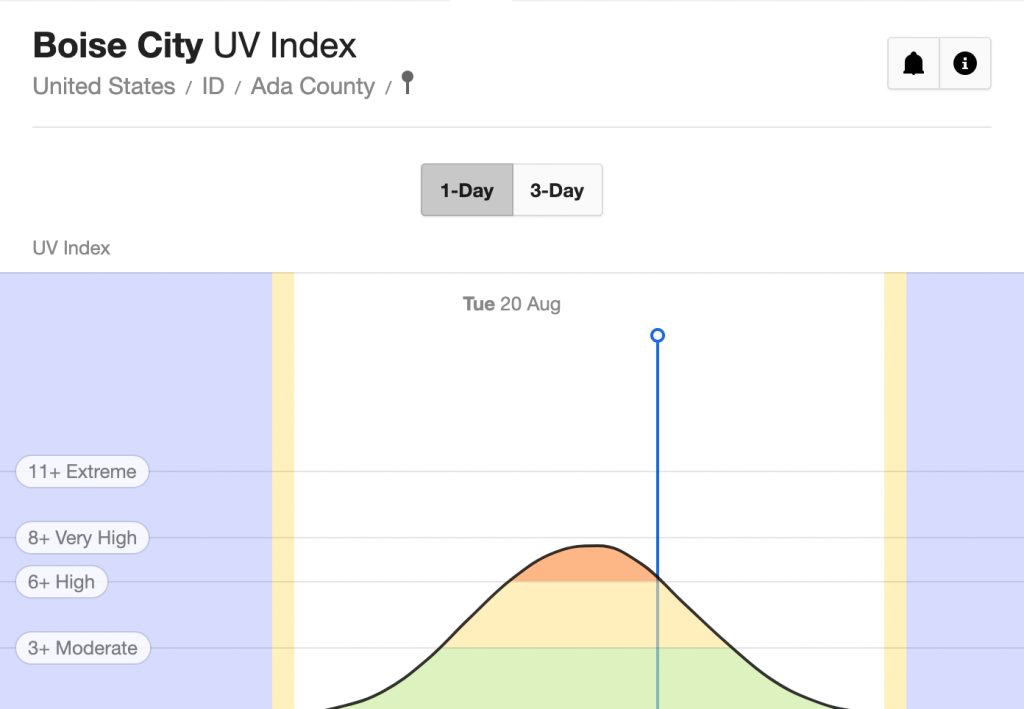
Similar to an air quality alert or severe weather alert, UV alerts are published to warn people playing or working in the sun to protect themselves. If you do a quick Internet search for your city name and UV index you will probably see a weather report that includes the UV index. Check out the chart and prepare yourself do a little UV exploration with databot™!
 If you haven’t setup your Science Journal app yet do that now and come back to these Sensor Starter activities.
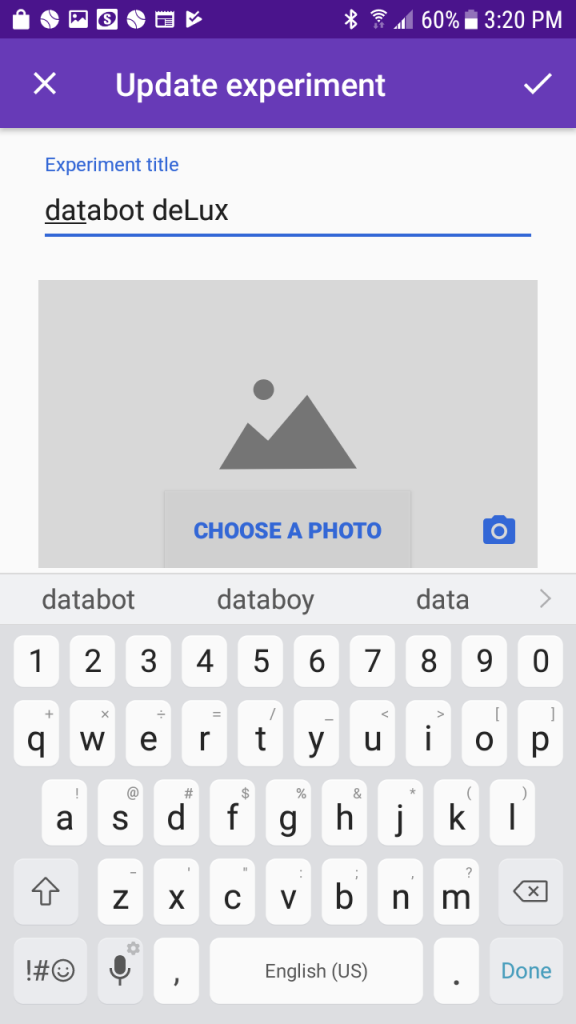
Begin your Ultraviolet Light explorations by creating a new experiment in your Journal as follows:
Congrats! Use the back arrow to exit your experiment and admire your work. Check out your newly titled and imaged experiment!
 Return to your experiment and open the sensor display area by clicking on the data icon in the observations section. It looks like a circle with a wavy line through it.
Depending on your device, a sensor display “card” will appear – perhaps the internal microphone or ambient light on the device or Chromebook you are using.
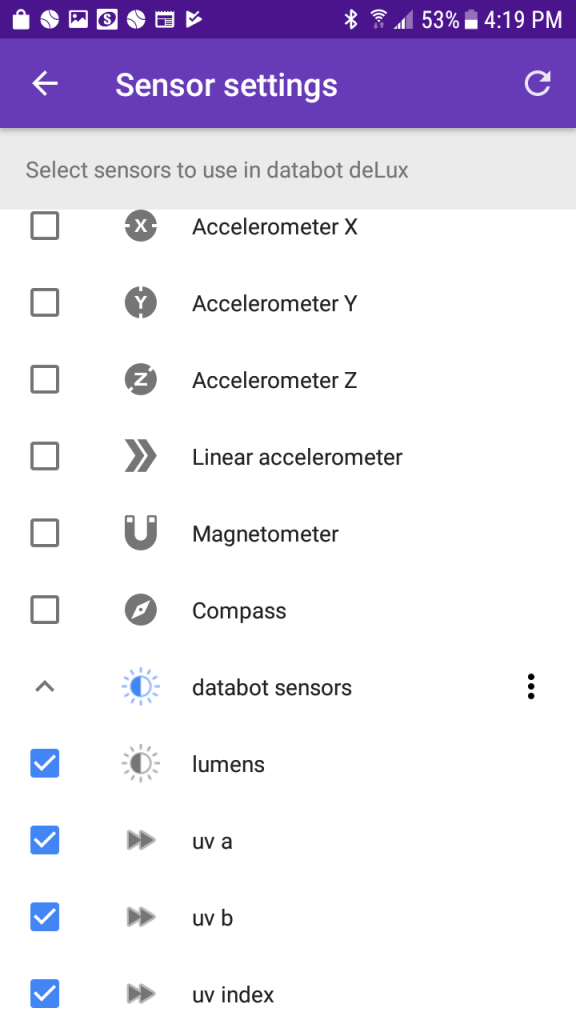
Time to get the UV sensor loaded!
Test it by watching the data display and covering and uncovering databot™ in the sunlight. You should see the data display change as the exposure to the UV rays changes.
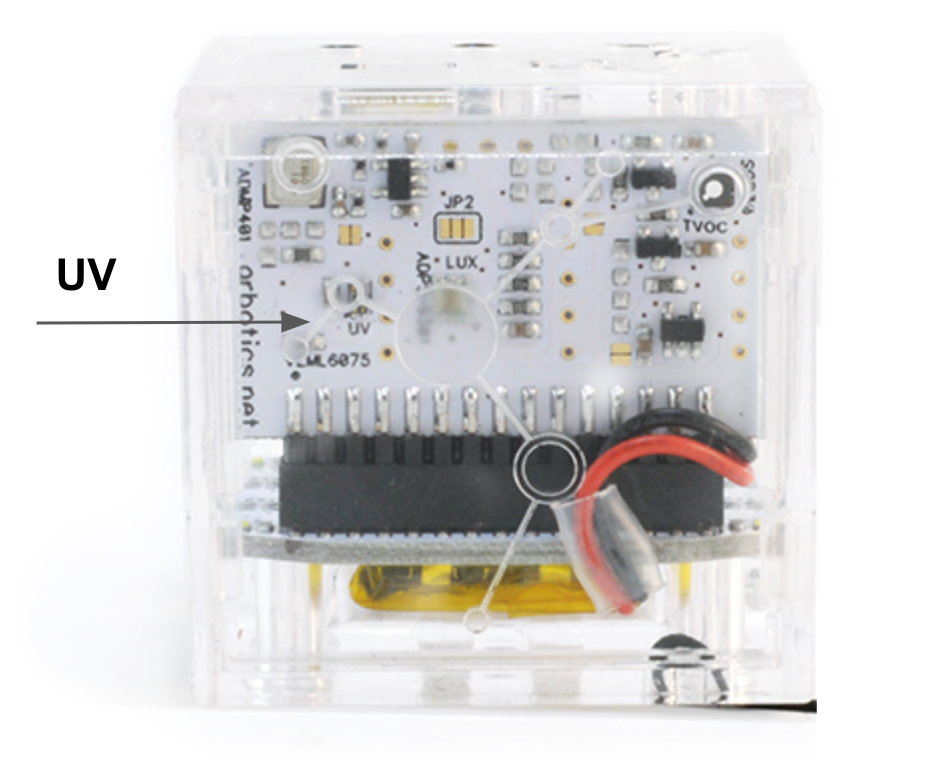
One of the objectives of the data game is to familiarize yourself and students with the construction of databot™ and where sensors and other components are located. Take a look at the main sensor board on the front of databot™ and look for the UV label. The sensor should look similar to the image at the beginning of this activity.
Depending on how many databots™ you have, pass one around the room and have students find it or put them into groups and challenge them to find it as a group. Tell them to look for the term “UV” and raise their hand when they find it.
It’s actually quite simple to find the sensor – it’s directly behind an opening in the front of the case that enables UV wavelengths to freely pass to the sensor. Polycarbonate has natural wavelength blocking characteristics for UV light so the hole is important.
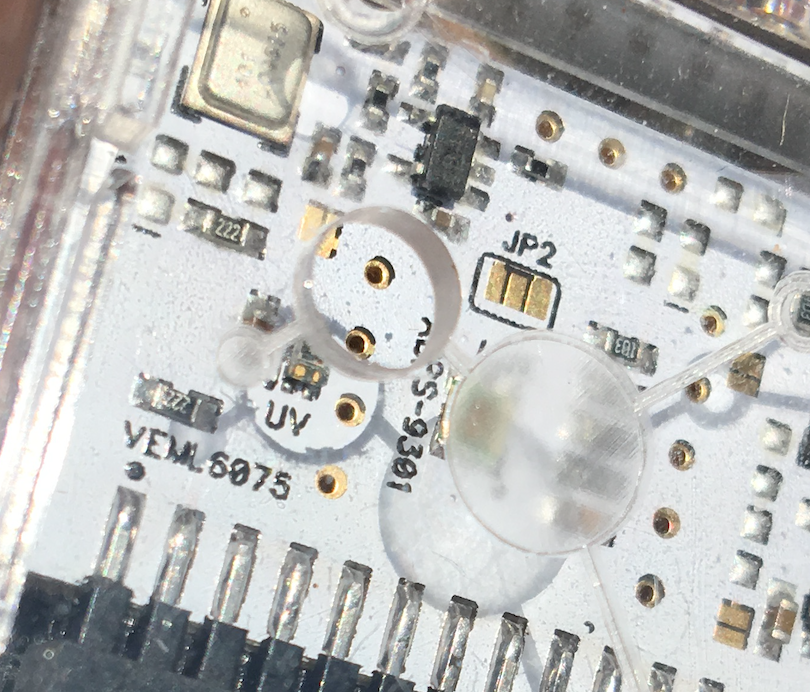
It’s now time to test out your data gathering skills and learn a special trick with your databot™. It’s called the “shadow sight” and it enables some precise alignment of the sun’s rays with the UV sensor located on your databot’s™ main sensor board.
Look at the picture velow, you will see a close up of the front of the databot™ case. Look at the hole in the case and you will see it’s projecting a shadow circle onto the sensor board. We call this circle the “shadow sight” and you can rotate and move your databot™ until you get the sight centered on the UV sensor as shown here:
Now, using your newly mastered shadow sight skills, use your Google Science Journal and databot™ to capture a ten second (or more) recording of the UV-A and UV-B levels as well as the composite UV Index. Compare your index finding to the chart shown above – are you in a UV level that is considered dangerous?

 Ultraviolet light travels in waves, and depending on the medium it is passing through certain wavelengths may pass through unhindered and some may be blocked. IMPORTANT: waves may be blocked even though the material is transparent, which is why there is a hole on the front face of the databot™. Your final challenge for the data game UV – find transparent materials such as plastic, plastic wrap, glass, or other items and attempt the following: