databot™ Basic Training

Sensor Starters: Sound

databot™ has the equivalent of “ears” in an on-board microphone / sound sensor that can help you better understand how sound behaves.  Listen closely and let’s get started!

Sensor Starters - Meet the Sound Sensor!


Databot’s sound sensor is an omnidirectional MEMS (Micro Electrical Mechanical System) microphone – the ADMP401 from Analog Devices. This sensor is another compact, low energy device that fits nicely into databot’s tidy little case.

As a multipurpose microphone it is used in a number of consumer and business type applications including smartphones, teleconferencing systems, video cameras, and more.

How does it Work?


A MEMS microphone works on the principle of a pressure sensitive membrane that is mounted to a silicon wafer. The pressure of the sound waves are transmitted by the membrane to the chip and converted to electrical signals.

How is Sound Measured and What is databot Reporting?

Sound Intensity

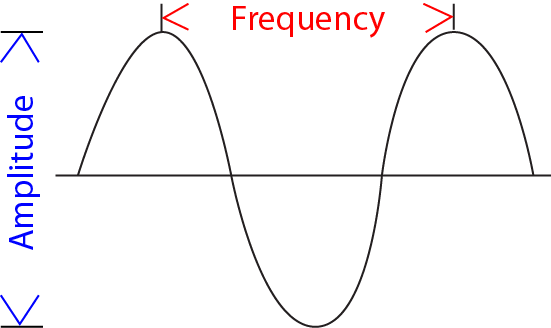
Sound intensity is what we typically think of as “loudness.”  If you look at an illustration of a sound wave “amplitude” corresponds to intensity.  The higher the amplitude, the louder the sound!

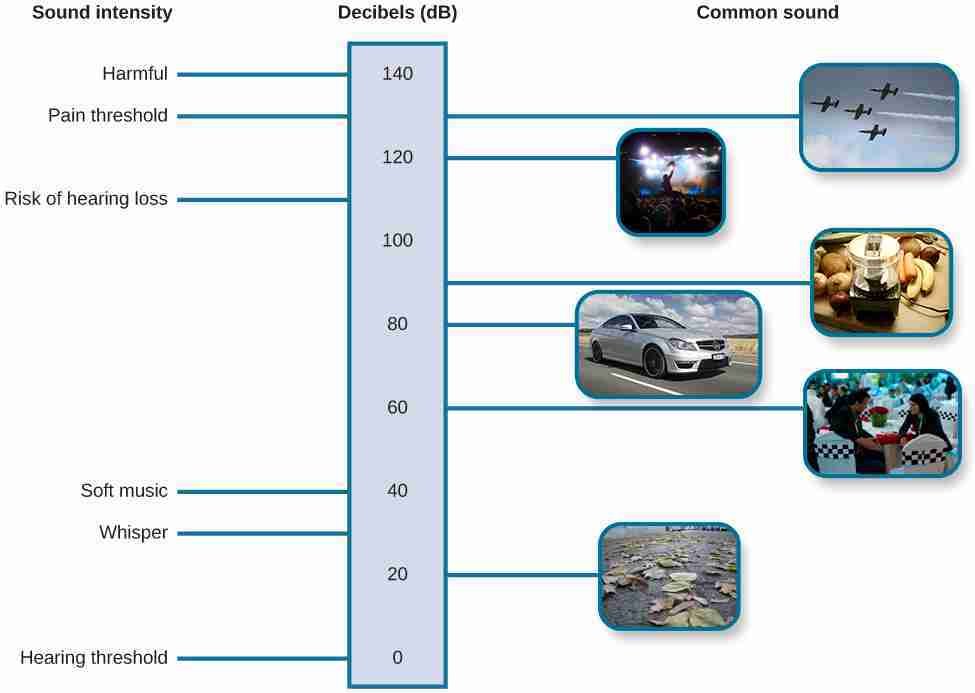
Sound intensity is measured in units called decibels.  The decibel scale is logarithmic, which means doubling the decibel units does not double the output, it can increase as much as 100 times! Normal conversation is about 60 dB, a soft whisper around 30 dB, and a lawn mower about 85 dB. When you look at the sound intensity output from databot, it is reading in decibels. 

The following chart gives you a general idea of the decibel levels of common sounds.


databot™ Basics: Ultraviolet Light

The working range for your databot sound sensor is 0-70 dB, and it is highly sensitive to lower noise levels and background noise as you will see when using it.

Science Journal Setup

If you haven’t setup your Science Journal app yet do that now and come back to these Sensor Starter activities.

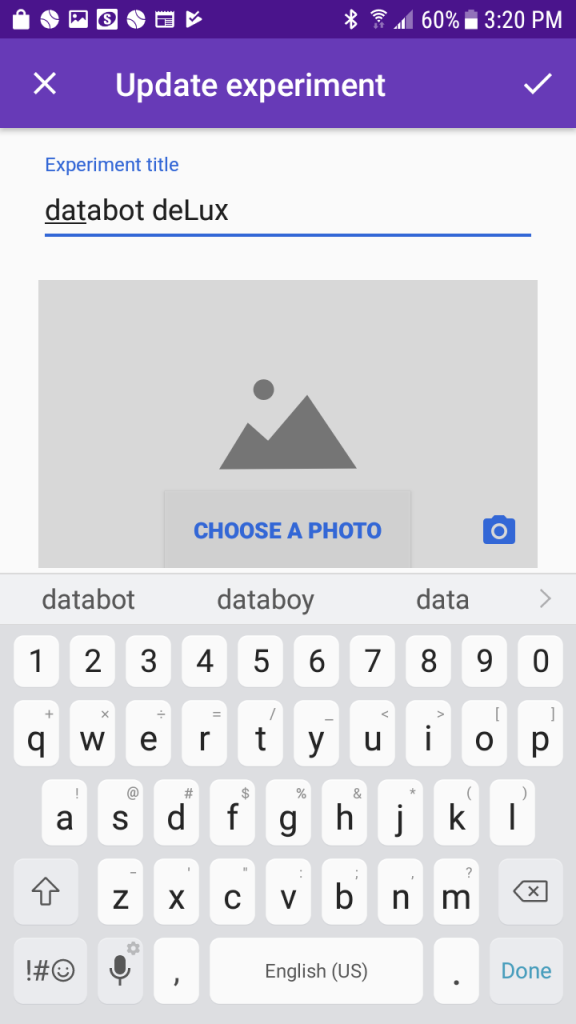
Begin your Sound explorations by creating a new experiment in your Journal as follows:

  1. Open Science Journal.
  2. Select the plus sign.  
  3. Select the pencil icon in the header bar to edit your title and journal display image.  
  4. Edit the title – give your new experiment entry an interesting and descriptive name.
  5. Add an image to the experiment so your portfolio is colorful  to look at.  You can take a picture or upload an image you like.
  6. Save this information by clicking on the check mark.

Congrats! Use the back arrow to exit your experiment and admire your work. Check out your newly titled and imaged experiment!

Science Journal Data Test

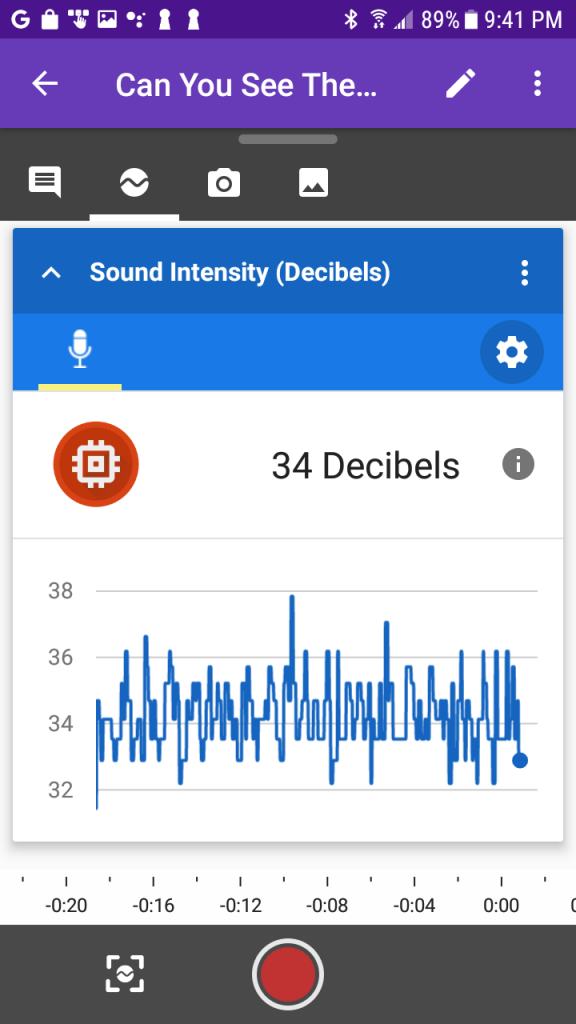
Return to your experiment and open the sensor display area by clicking on the data icon in the observations section. It looks like a circle with a wavy line through it. 

Depending on your device, a sensor display “card” will appear – perhaps the internal microphone or ambient light on the device or Chromebook you are using.

Time to get the Sound sensor selected! 

  1. Enter the Sensor Settings menu by selecting the “gear wheel” on the open sensor card.
  2. De-select all sensors except the Sound Intensity option beneath databot sensors.
  3. Exit the sensor settings menu using the back arrow.
  4. Your Sound Intensity levels should now be displaying in Science Journal.

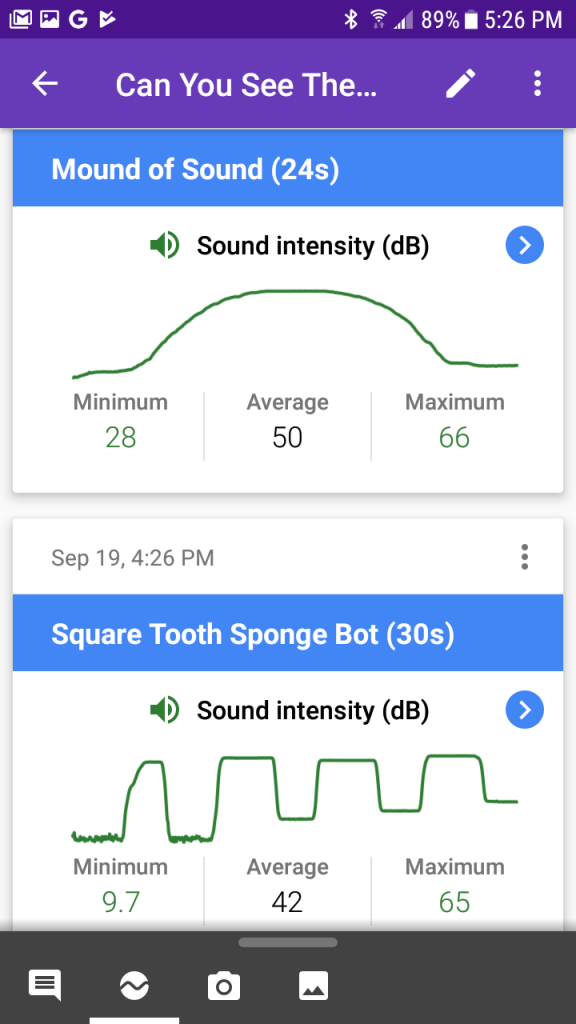
Test it by watching the data display and humming into the microphone.  You should see the data display change as the sound level changes (see expected screen display in next section).

Welcome to the Data Game - Decibel Hunting!


The Data Game is a quick and fun introduction to databot sensors that includes each sensor’s location on the ‘bot,  what it measures, and its units.  Use these Data Game Challenges to quickly engage students and convey some important core science concepts.

Familiarize yourself with sound levels by experimenting with  databot™ and watching the sound intensity readings. Use the decibel level example table above to gain a general understanding of decibel levels and their real-life counterparts. 

Prepare to give your students some fun challenges!

The Data Game - What is a decibel?

Introduce students to the terms decibel and sound intensity and explain how decibels are used to provide a measurement unit for sound intensity (loudness).  You can use the provided decibel chart to help introduce the concept of the varying intensities of sound and the decibel level they represent.  

Prepare the students for some challenges now with sound using databot!

Challenge 1 - Find the Sensor!

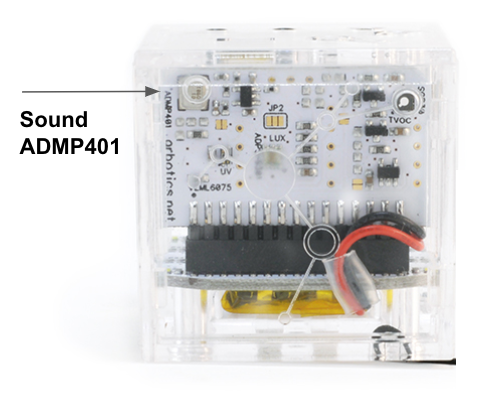
One of the objectives of the data game is to familiarize yourself and students with the construction of databot™ and where sensors and other components are located. Take a look at the main sensor board on the front of databot™ and look for the ADMP401 label.   The sensor should look similar to the image at the beginning of this activity.

Depending on how many databots™ you have, pass one around the room and have students find it or put them into groups and challenge them to find it as a group.  Tell them to look for the sensor by the name or picture and raise their hand when they find it. 

It’s actually quite simple to find the sensor – it’s directly behind the opening in the upper left corner of the case that enables sound waves to pass more freely through the case to the sensor.  

Challenge 2 - Etch a Sketch with Sound!

Experiment with your sound levels and watch the image that is generated by the graphic display.  Can you draw the following shapes with sound?


1. A round mound.


2. A square


3. Can you do a triangle?


Work with a friend to record your best efforts and share them with your class.   Which shape is toughest to produce and why?

Using your new found sound skills, can you create an image using just sound that is recognizable to others with no explanation?

Challenge 3 - Go the Distance, databot. Go the Distance...

Work individually or as a team to come up with a sound source that delivers 60 dB of sound intensity.

Using only distance from the 60 dB sound source as your tool, reduce the sound reading fo 55 dB.   Measure the distance.  

Move again until the sound intensity reads 50 dB.  

Measure the distance.  Now predict the distance required to achieve a db level of 45 and write it down.  Test your hypothesis and record your finding.  Were you correct?

Do you notice anything unexpected about your measurements and investigation?

Attribution & Resources

  1. Loudness of Common Sounds
    Lumen Learning [CC BY-SA 4.0 (https://creativecommons.org/licenses/by-sa/4.0)]
    https://upload.wikimedia.org/wikipedia/commons/5/5e/Loudness_of_common_sounds.jpg
  2. Reference and Background Wikipedia – MEMS
  3. Wikimedia Commons, Public Domain; https://commons.wikimedia.org/wiki/File:SoundWaveDiagFreqAmp.png
  4. “The “Data Game” idea provided by Jeremy Mallet, St. Basin Catholic School; databot™ Giveaway 2019.

Wrap Up!

This concludes your introduction to the sound sensor!  Challenge your students to come up with their own experiments to go deeper, and explore the growing body of activities using all the databot sensors in the lessons and activities area.

Ready to Move On?

If you’re doing the Sensor Starters in order, your next stop is the Air Quality sensor!  Good luck and have fun!

Explore CO2 & VOCs!