databot™ Basic Training

SD Card and Serial Data Basics!

databot™ has the ability to talk data in many ways – writing to memory, sending it to your favorite spreadsheet and more. Learn how here!

Take Control of Your Data Easily

Micro SD card and readerThis help section requires you to have completed the Arduino IDE basic setup as you will be loading a pre-built program from the databot™ library and flashing it to databot™.  If you have not done this step, please do so now

databot™ has the ability to store data on its internal SD card (8 GB) as well as to communicate a stream of live serial data that can be read by many programs including Microsoft Excel or the Arduino Serial Monitor or Plotter.  

To do this, you simply load a pre-built Arduino Sketch into your Arduino IDE software, make any changes to the sketch you might desire, then upload the Sketch to your databot™.  This process allows you to easily accomplish the following:

  • Select the specific sensors you want to record. You can turn all the sensors on or off as you desire.
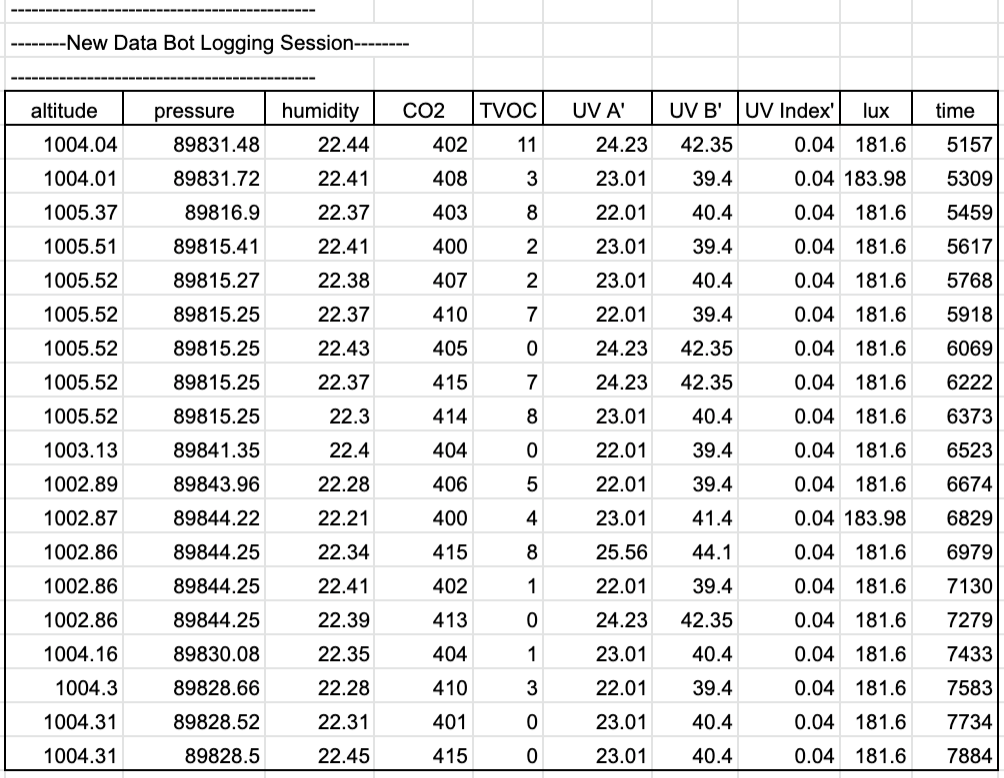
  • Target the data to write a file to the SD card, stream, or both.  For collections where you will not be connected to databot™ in real time, it’s necessary to log the data to the SD card for later evaluation. The screenshot to the right is an example of a databot™ CSV file that you can open in Sheets or Excel or other software.
  • Change the sample rate of your sensor.  This is very useful for specific applications.  For example, taking humidity and temperature readings every 4 hours over the course  of a week.  Or perhaps you want to sample accelerometer data at a thousand samples a second to capture some kind of launch data.

Let’s try it!  Follow these simple steps to get up and running – 1) Run your  your Arduino software, 2) Select the master “sketch” for this purpose; 3) Make any adjustments to the data you want and where you want it; and 4) Flash the new program to your databot™.

Set Up for Live Serial Data Display

Again, we are assuming you have already set up  the Arduino IDE software and you’ve installed the databot™ Arduino library.  If not, go through the Arduino setup first.  


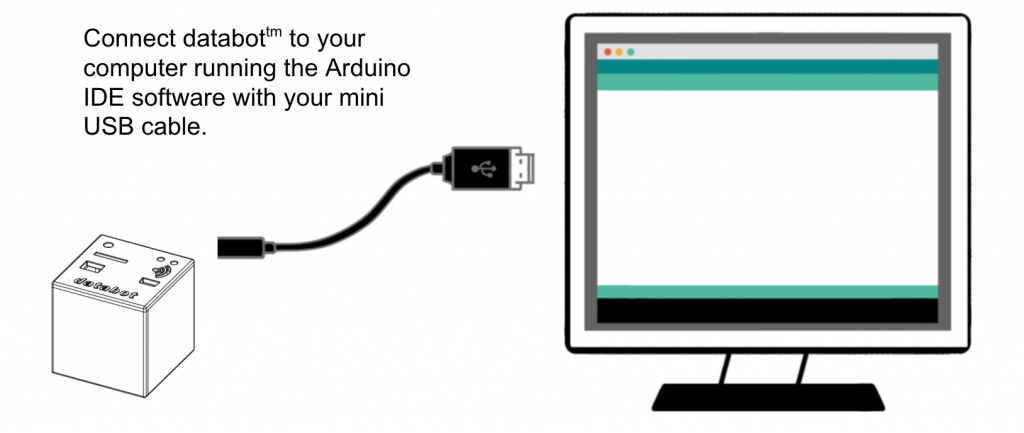
Step 1: Connect your databot™ to your computer using the supplied mini USB cable.

Step2: Select the Master_Serial_CSV sketch from the databot™ library:


 Go to the File menu and navigate to the following sketch and select it:


Examples/databot/IDE/Master_Serial_CSV


Note: CSV stands for Comma Separated Values and is a standard format for transferring data between programs.  You will notice in Excel or other spreadsheets the option for saving or opening a CSV file, as well as whatever the native file format for the software might be.

Step 3: Let’s Edit the Sketch!

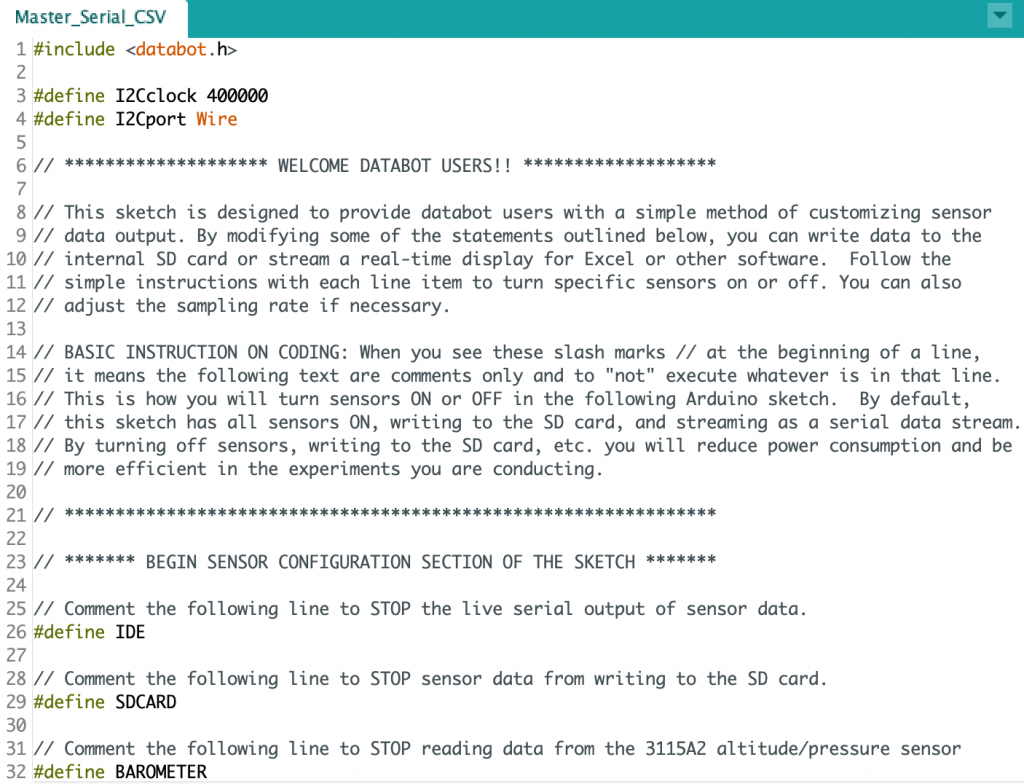
 When you select the Master_Serial_CSV file, it will open and display similar to what you see to the right.

The introductory text in the Sketch explains how to adjust the code using forward slash characters //.  Whenever you place // at the beginning of a line the Arduino compiler will ignore it.  This allows you to easily turn your sensors and actions on and off.

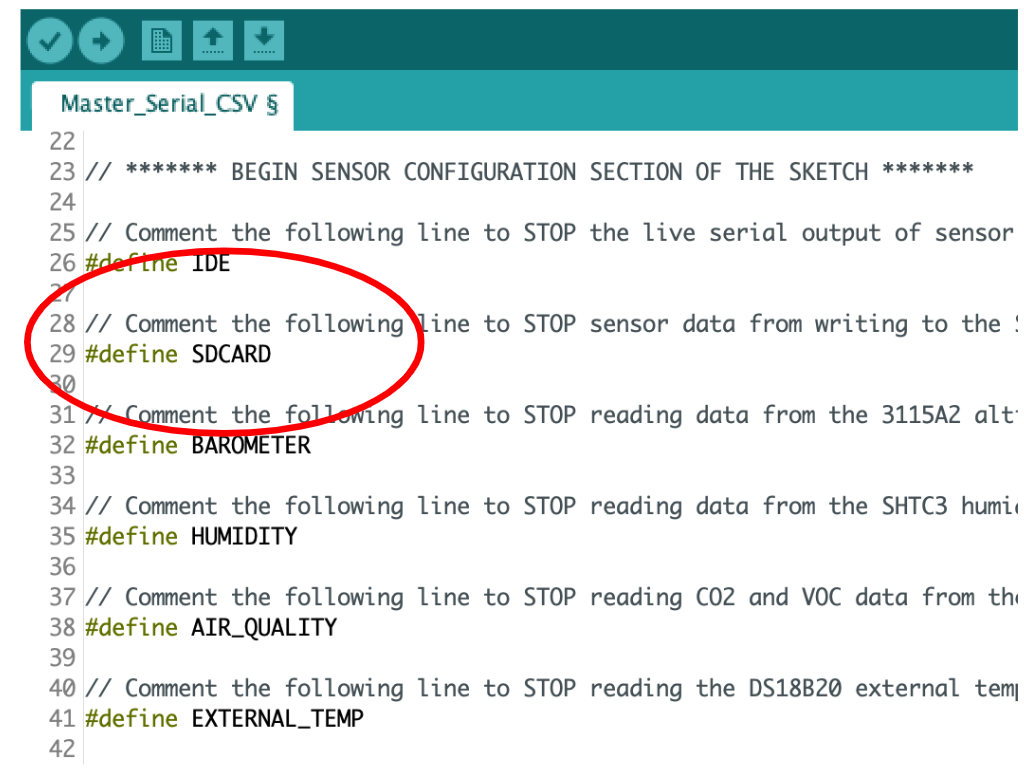
Edit to Turn Off the SD Card:  By default, when you flash this sketch to databot™ all sensors are ON and streaming values live as well as writing these values to the SD card.  We will edit the sketch by placing // in front of the line that says #define SDCARD as follows:

// #define SDCARD

Step 4: Transfer the edited sketch to databot™!

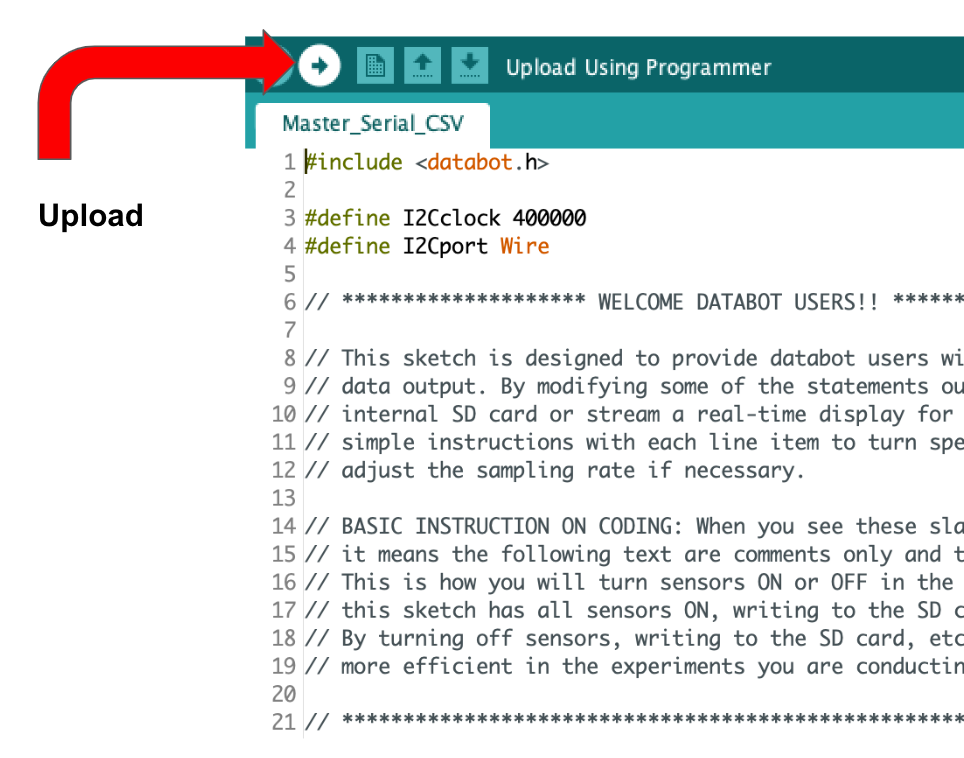
 Once you have made your edits,  click the arrow pointing to the right at the top of your sketch window.  This is the “upload” icon and will transfer this sketch to databot.  Upon upload to databot™ the sketch will be running  and reading sensor data!  This upload process is also referred to as “flashing” – you are flashing a new program to databot‘s onboard memory.

Note: Remember, when you upload sketches to databot™ you will notice the Transmit (green)  and Receive (blue) LEDs flashing.  databot™ is listening and learning!  Point this out to students when they are uploading sketches to highlight the programming process. 

Now let’s look at the live data with the serial monitor!

Our simple edit turned off the file writing to the on-board SD card, but we left all of the sensors ON so databot™ is now actively broadcasting a serial stream of data that includes all sensor values.  Make sure you leave databot™ plugged in to your computer, we’re going to look at some data now!

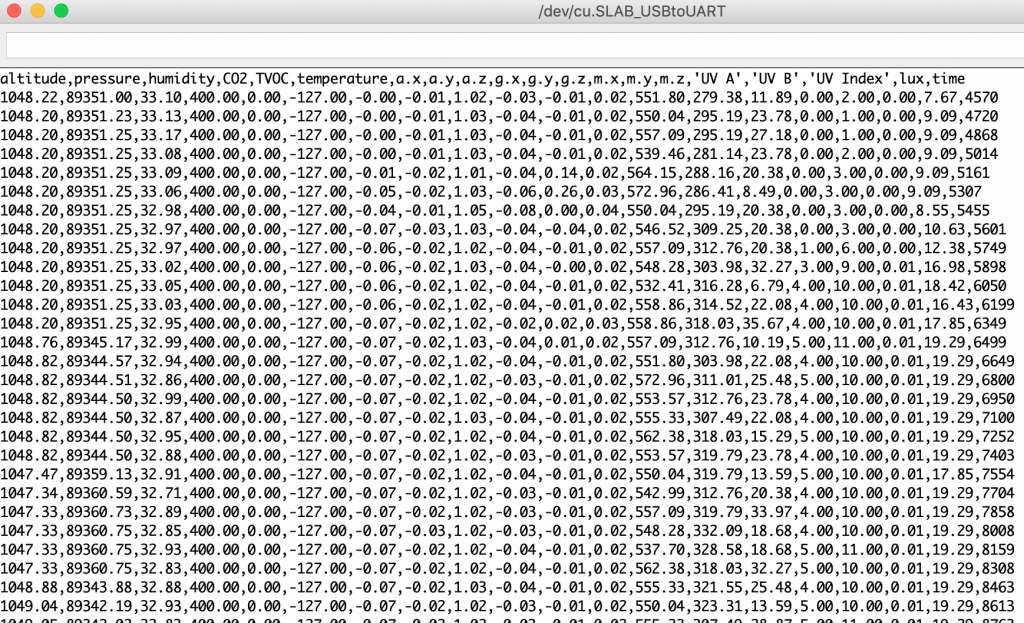
To see the serial stream of sensor values, go to the Tools menu and select the option for the Serial Monitor.  Your data should begin displaying as shown to the right. Look closely at the data, you will see commas between values (CSV= Comma Separate Values).  

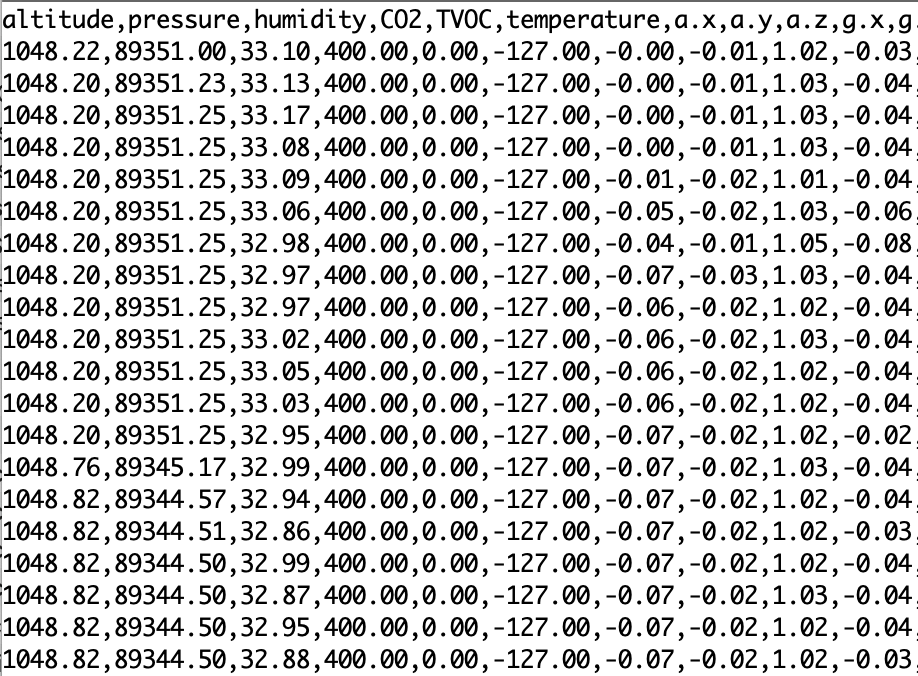
In our closeup of the data shown here, you will note the first row of data highlights the name of each sensor being displayed.  You can turn off the “autoscroll” setting at the bottom of your Serial Monitor window to halt the screen from scrolling and you can move to the top of the file and see the labels.   Even with autoscroll off, data will continue to accumulate in your serial monitor as long as you are connected to databot and the sketch is running.

Notes on the data shown here: CO2 and VOC values do not begin to report correct values for a short warmup period (15-30 seconds). The default values of 400 PPM and 0 PPB will display until it has warmed up;  If the external temperature probe is not connected it will report a value of -127.

Practice selecting sensors!

Let’s select some specific sensors to display.  Close your Serial Monitor and go back to your open Master_Serial_CSV file. Use the // again to comment out all sensors except for Humidity, Air Quality, and Lux (light). Now, upload the changed Sketch and re-open your Serial Monitor.  You should see a display similar to the right. 

This is how you can select specific sensors for experiments you want to conduct.   To use the data in a spreadsheet or other program you can also copy and paste data straight from your Serial Monitor window into another application. You can also live-stream data directly into Microsoft Excel using the Data Streamer add-in, or use the live data in many other ways.   

Next, let’s look at how to write the data to a file on the SD Card, and open it up in a spreadsheet.


Change Your Sample Rate

As you begin to use databot™ in more diverse ways you will discover you want to be able to change the “sample rate” for your sensors.  For example, taking humidity and temperature readings every 4 hours over the course  of a week.  Or perhaps you want to sample accelerometer data at a thousand samples a second to capture some kind of launch data.

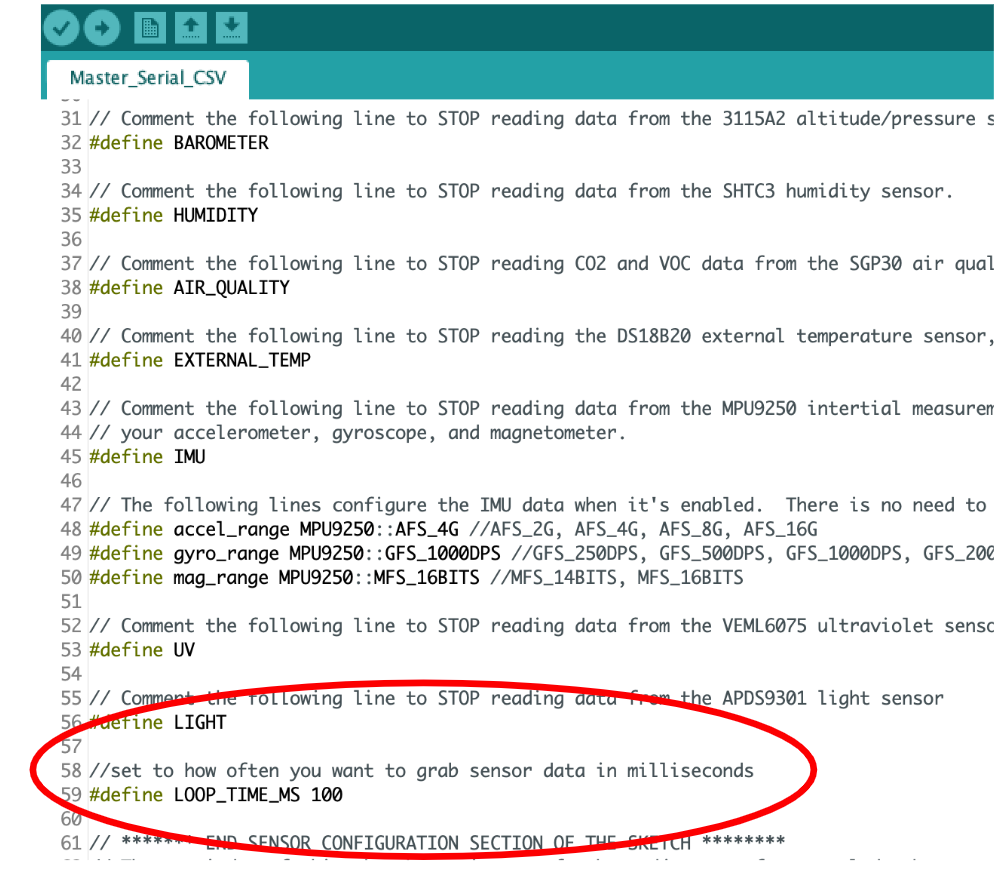
Look at the code to the right and you will note the default sample rate is 100 milliseconds, or 1/10 of a second.  This means the loop executes 10 times per second grabbing sensor values with each loop.  If you want to take a sample once an hour you simply calculate how many milliseconds in 60 minutes: 60 Minutes X 60 Seconds X 1000 = 3,600,000 and modify the loop time:

#define LOOP_TIME_MS 3600000

That’s it!  Now you can select only the sensors you want and control how frequently you sample data.  Easy!

Using the SD Card

Edit your file to write data to the SD card.

Now that you are  becoming skilled at editing an Arduino Sketch, we can go back to the Master_Serial_CSV file and modify it for writing data to the SD card.

Note the circled statement to the right – remove any commenting  // from the SDCARD line and the SD card will be activated. Go ahead and un-comment all sensors in the configuration section for this exercise so you can see a complete data set being written.

Flash the new program to your databot™ and it will immediately begin writing data to the SD card.   

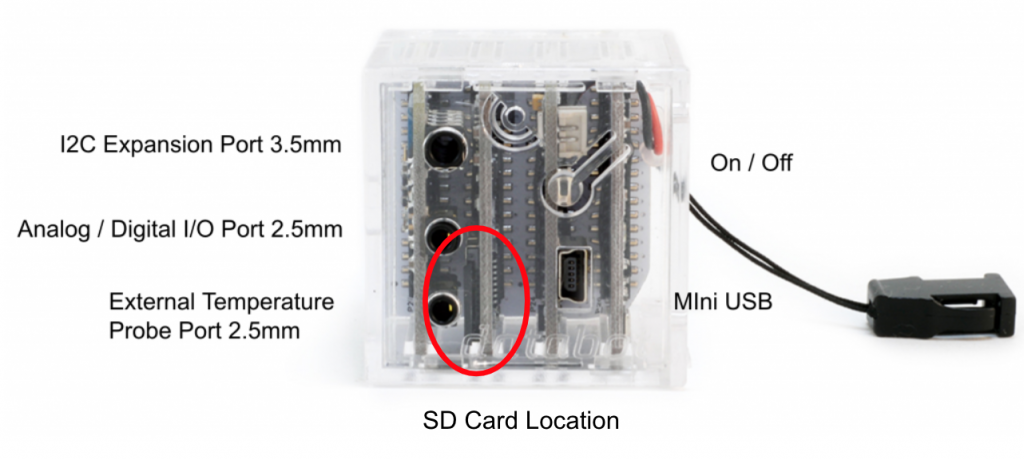
Look closely at the SD card circuit board with databot turned on.   You should see a tiny red light flashing.  When you see this light it means data is being written to the SD card.

Write some data and remove the SD card.

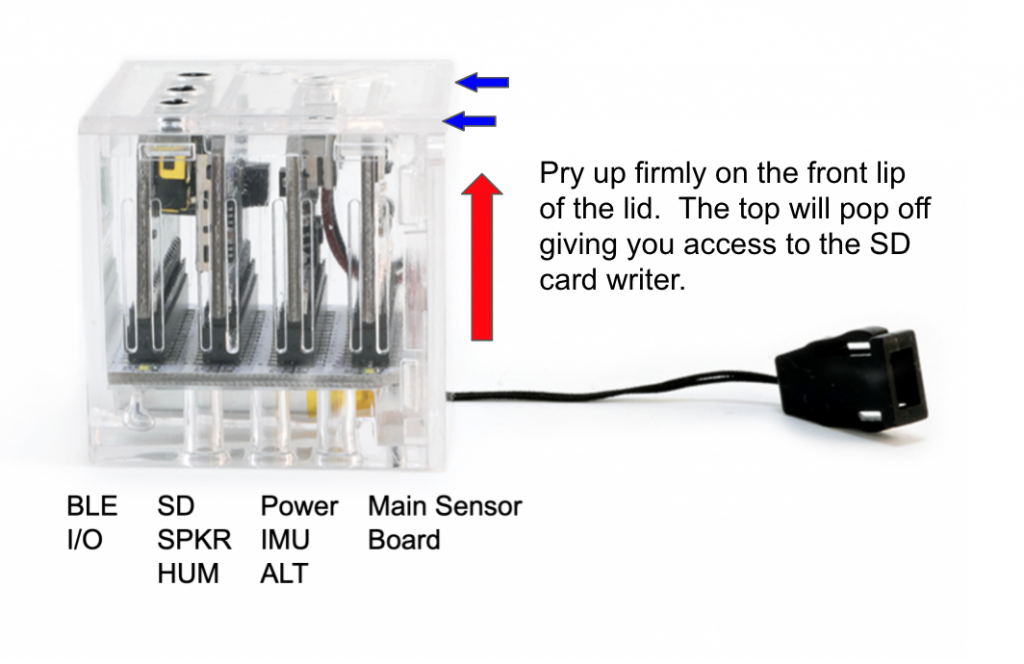
Now that you have flashed databot with a sketch that writes data, unplug it from your computer.  Turn databot off, then on. Watch the tiny red light again. You will observe a series of flashes then the steady flashing as it writes data.  Turn it off, then on again, several more times and watch the red light process.  Now, turn it off, and remove the top of databot to access the SD card.

To remove the lid, simply grasp your databot™ with the main sensor board facing forward (expansion ports to the back), and pry straight up on the slight lip you will feel at the front of the lid.  It should pop right off.  Remove the SD card carefully from the writer and insert it into the provided USB card reader. Insert it into your computer.

Important Notes: 

1) It’s easier to get the lid off after the first round.

2) The card writer is spring loaded – beware your card might eject!

3) Instructors and teachers may want to reserve pop-topping privileges  as students might be tempted to poke around inside databot™.  databot™’s tough, but that might be too much!

SD card use, behavior, and file handling.

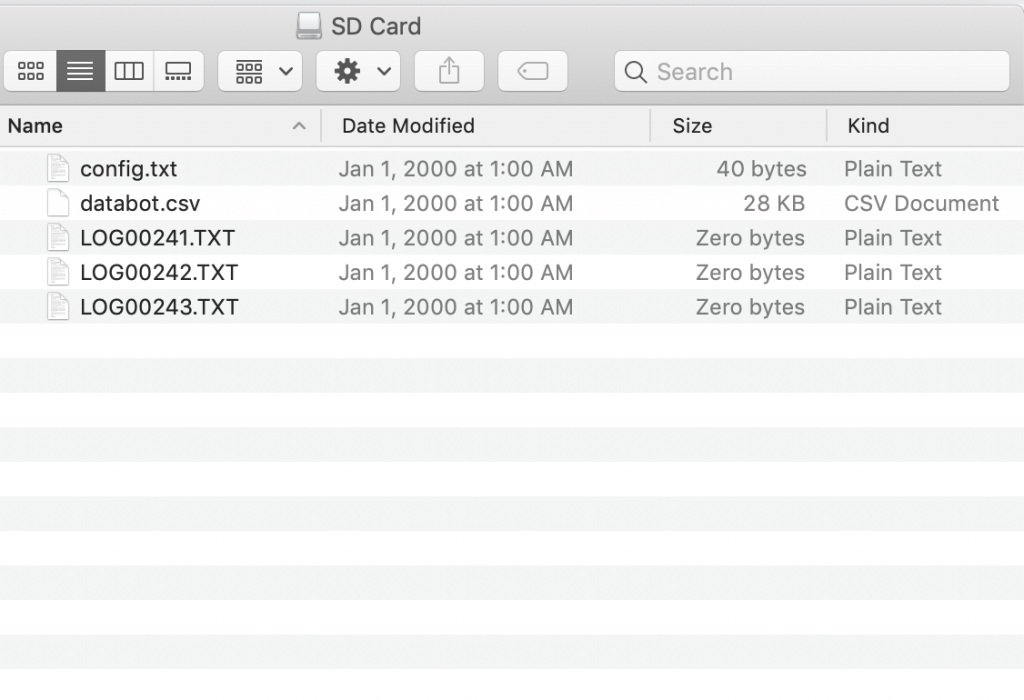
Open your SD card reader in your file manager.  The one shown here is an Apple, but yours should be similar.  There are several simple behaviors to understand when using the SD card function.  

1. Each time databot™ is powered on, it begins writing a new set of data.  Each data set is appended to the single  databot.csv file you will find on the SD card.

2. When you unplug databot™ from your computer, it will cycle the power and start a new data set, just as if you turned the power off and on.

3. After the initial CSV file is created,  each time a new data set is started a log file is also written to the SD card to indicate a new “write” has taken place.  These log files are empty and can be deleted each time you work with the SD card.  

The sample directory listing shown to the right indicates four different data sets have been written. The original CSV file and 3 appends.  Look at yours – how many data sets were written as you experimented?

Last step! Let’s look at your data!

Using your favorite spreadsheet, you can now open your data file – databot.csv – and see what it looks like.  

The file to the right has been made a little prettier by adding grid lines and centering the data headers.  When you open a CSV file it will typically be just raw data organized into columns and rows.  

At the top of this file, you will also see the header, “New databot Logging Session.”  This will appear with each new data set written to the CSV.  Scroll through your data and see how many data sets were written to databot as you turned it on and off.

That’s it!  You are now prepared to begin collecting and analyzing all kinds of data with your SD card!

Congratulations! 

You have successfully completed your exploration of how to select, display, and store serial data from  databot sensors.   Now that you are empowered, come up with some exciting ways to use databot to study the world around you and explore data.  Have fun!

To Lessons & More