Bot Basics!
databot™ Basic Training
Check out this growing list of pre-built MicroBlocks solutions ready to click and load!

MicroBlocks is a drag and drop coding environment optimized for physical computing that makes working with databot sensors, lights, sound, and network tools a snap!
The following gallery of examples provides ready to go code for a variety of projects. Just click the link and these will pre-load right into your MicroBlocks environment!
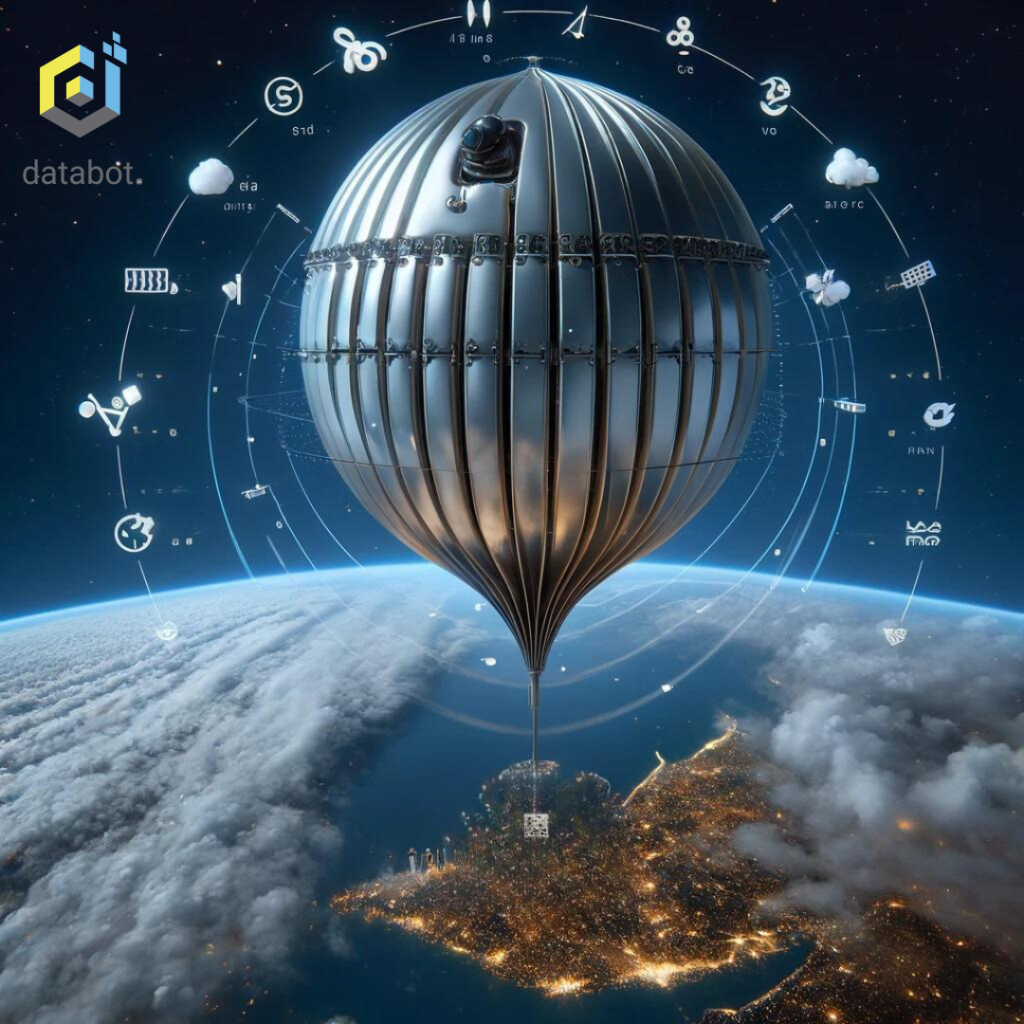
High Altitude Data Collection!
This code was developed to capture environmental and physical data during the flight of a high altitude weather balloon. These balloons typically ascend to heights of 100K-120K feet, high enough to see the curvature of the Earth!
This code captures data from the following sensors at a sample rate of 1 sample every 6 seconds.
Acceleration, Magnetic Field, Altitude, Air Pressure, CO2, VOC, Humidity, Temp 1 (inside the pod), Temp 2 (External Temp), Light, UV Index, & Color
Operation is simple, whenever you turn databot on it will begin appending the sensor values to a file called balloon.csv You can leave it running, or turn it on whenever you want to capture the data. Download the data file by reconnecting to the databot with MicroBlocks and accessing it by the File menu.
| Sensors Used | Behavior | Sample Rate |
|---|---|---|
|
Acceleration, Magnetic Field, Altitude, Air Pressure, CO2 , VOC, Humidity, Temp 1, Temp 2, Light, UV index and Color. |
When you power on databot it will immediately begin recording data to internal memory. If it is the first time the program is run, it will create a data file called balloon.csv. If the file already exists it will begin recording and append the new data to the existing file. |
6 seconds (10 samples per minute) |
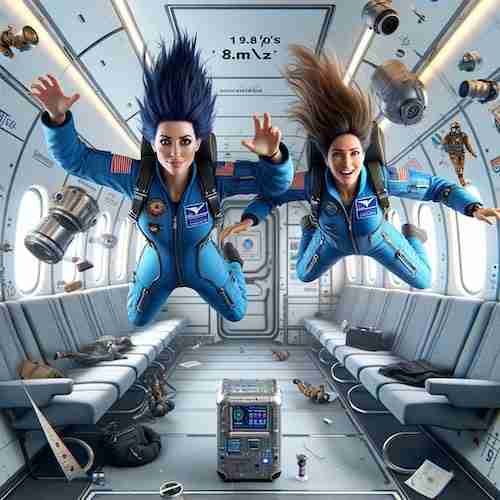
Zero G Data Collection!
This code was developed to capture physiological responses to stress incurred in a microgravity (Zero G) flight.
The code captures CO2, Humidity, heart rate (using a customized I2C MAX 30105 pulse rate sensor), altitude, and acceleration.
Operation is simple, whenever you turn databot on it will begin appending the sensor values to a file called zerog.csv You can leave it running, or turn it on whenever you want to capture the data. Download the data file by reconnecting to the databot with MicroBlocks and accessing it by the File menu.
| Sensors Used | Behavior | Sample Rate |
|---|---|---|
|
CO2, Humidity, Pulse Rate, Acceleration, Altitude |
When you power on databot it will immediately begin recording data to internal memory. If it is the first time the program is run, it will create a data file called stress.csv. If the file already exists it will begin recording and append the new data to the existing file. |
200 milliseconds (5 samples per second) |
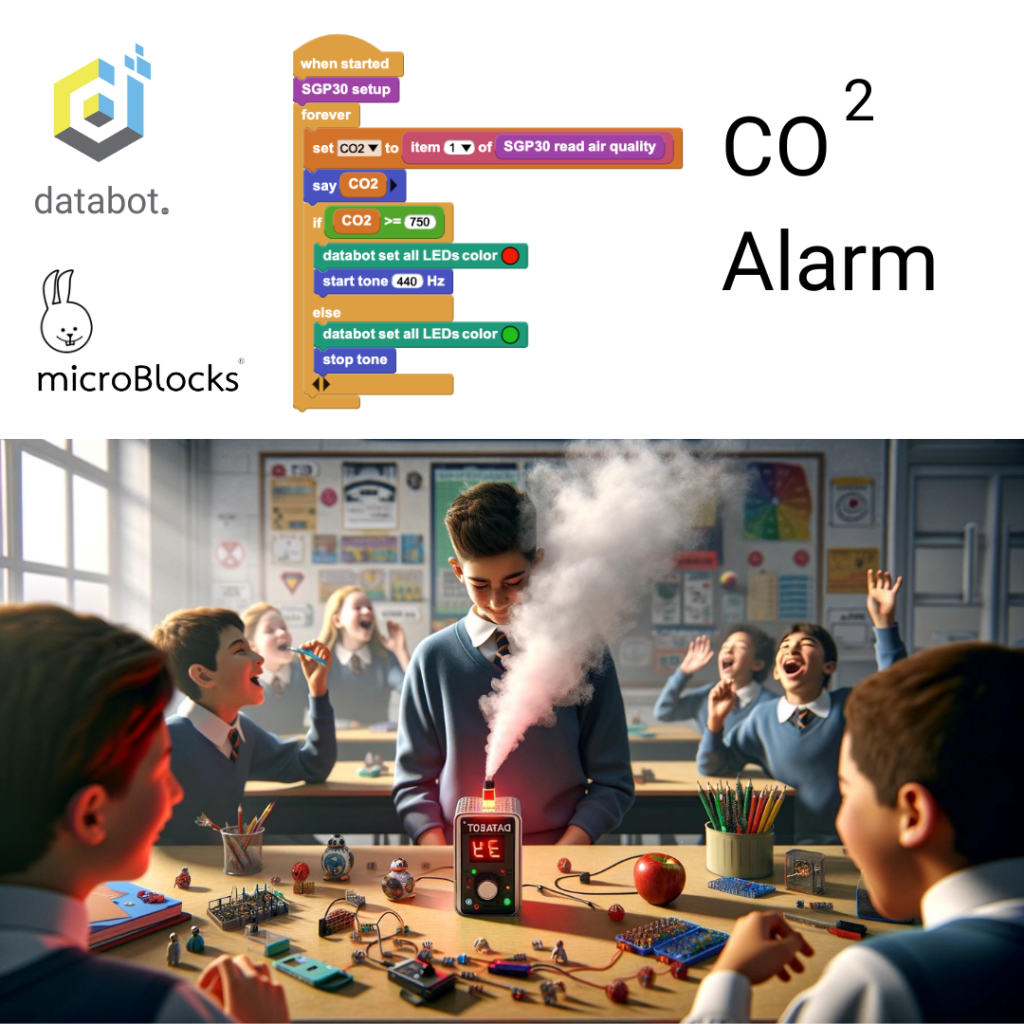
CO2 Alarm!
This simple code detects CO2 levels higher than 750 PPM – when it does it squawks and turns red. Bad breath? No, just exhale!
| Sensors Used | Behavior | Sample Rate |
|---|---|---|
|
CO2 Plus Tone and LED Output |
When you power on databot it will run the program, light up green LEDs (for good air quality) and begin monitoring CO2 levels. If you breathe on it or it detects CO2 from other source at a level of 750 Parts Per Million (PPM) or higher, it emits and tone and turns the LEDs red. Once the level drops below the threshold, the sound stops and the LEDs shift back to green. |
100 milliseconds (10 samples per second) |
Launch!
Imagine building rockets, balloons, or catapults that can launch things into the sky! Now imagine capturing the data from these exciting launches. This is easily accomplished by installing databot on your device and recording the flight information.
Simply load this code using MicroBlocks and launch your device to collect acceleration and altitude data. Once the device is recovered from the flight download the file through MicroBlocks and see how high you flew!
Rick Stoddard, a Galileo STEM Academy teacher, developed the code to launch the rocket. You can use it.
| Sensors Used | Behavior | Sample Rate |
|---|---|---|
|
Acceleration, Altitude |
When you power on databot it will immediately begin recording data to internal memory. If it is the first time the program is run, it will create a data file called launch.csv. If the file already exists it will begin recording and append the new data to the existing file. |
100 milliseconds (10 samples per second) |

How to get started in IOT
IoT, or Internet of Things, is a concept related to a network of devices connected to the internet to share data and interact without direct human involvement.
The basic idea of IoT is that devices are equipped with sensors and are connected to a network that allows them to collect data, analyze it, make decisions and interact with other devices.
You can read more details by clicking here
| Sensors Used | Behavior | Sample Rate |
|---|---|---|
|
Any |
When you power on databot it will immediately seek a wi-fi connection and begin broadcasting your selected sensor data by MQTT to the service of your choice. |
Configure this in the code based on your IOT service capabilities and the realistic needs of your project. |
Capture the Flag
A series of databot beacons that change color from red to blue and vice versa are placed around the room. Your goal is to flip all the beacons to your team’s color by hovering over a beacon for a second. Databot’s distance sensor will determine the accuracy of your flight. Drone teams compete over a period of time to capture as many colored beacons as possible. When the timer goes off the team with the most beacons glowing in their color wins!

Johann Sebastian Joust
This is a physical computing game where two opponents face off. They must protect their databot and prevent it from tipping more than 40 degrees as they attempt to jostle their opponent in to tipping. It is a game of four points with a databot color change indicating your game status. Starting color = green; Down one point = yellow; Down two points = blue; Down 3 points is your last warning – PURPLE!; The final point loss yields the color RED and plays a siren to let you know you have lost. Good luck, good coding, and good jousting!
