

Welcome to the Databot family!
Welcome to Databot! You’re joining educators and learners around the world who are using live sensor data to make science, math, data science, coding, and STEM more engaging and hands-on.
This Getting Started guide is designed to get you up and running in just a few minutes. We’ll show you what’s in your kit, how to charge and turn on your Databot, and how to connect with Vizeey on your smartphone and start reading live data right away. You’ll also learn how to give Databot a unique ID to easily identify in the classroom and how to update firmware.
Once you’re up and running, you’ll move on to exploring the different ways you can use Databot—from quick, inquiry-based explorations with Vizeey, to deeper data analysis with CODAP, to coding and physical computing with MicroBlocks.
Whether you’re teaching elementary students, running high school labs, or learning at home, Databot makes it easy to bring real-world data into science and math.
Ready? Let’s get your Databot running!
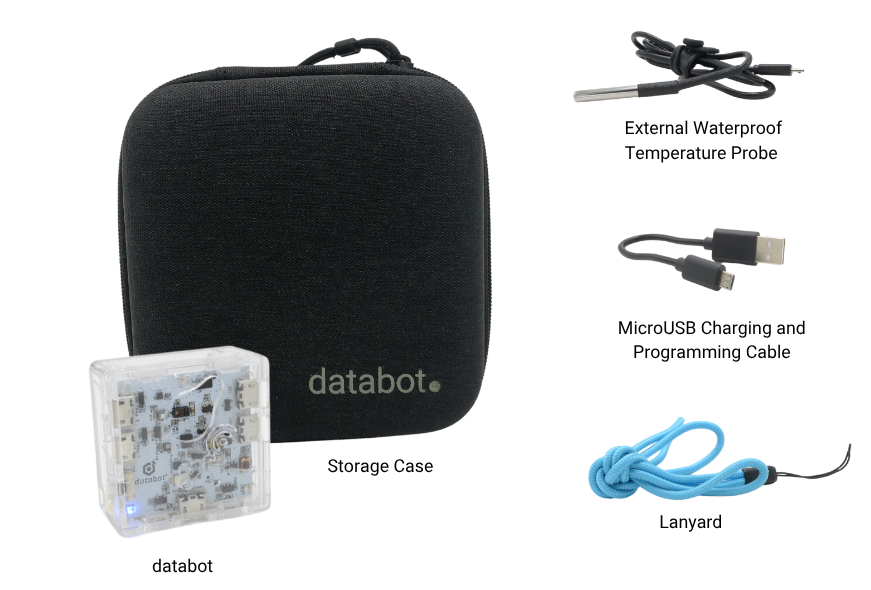
Kit Contents
Your Databot kit includes four items, all stored in the soft-shell case:
1. External Temperature Probe
Waterproof and ready for hands-on experiments. Place it in a beaker, stream, or other liquid to measure temperature.
Important: Databot itself is not waterproof.
2. Micro-USB Cable
Use this cable to charge your Databot and connect it for programming.
3. Lanyard
Loop it through the hole in one corner of the Databot enclosure. Wear Databot around your neck to collect data while you move, or use the lanyard for motion experiments such as swinging Databot like a pendulum.
4. Databot
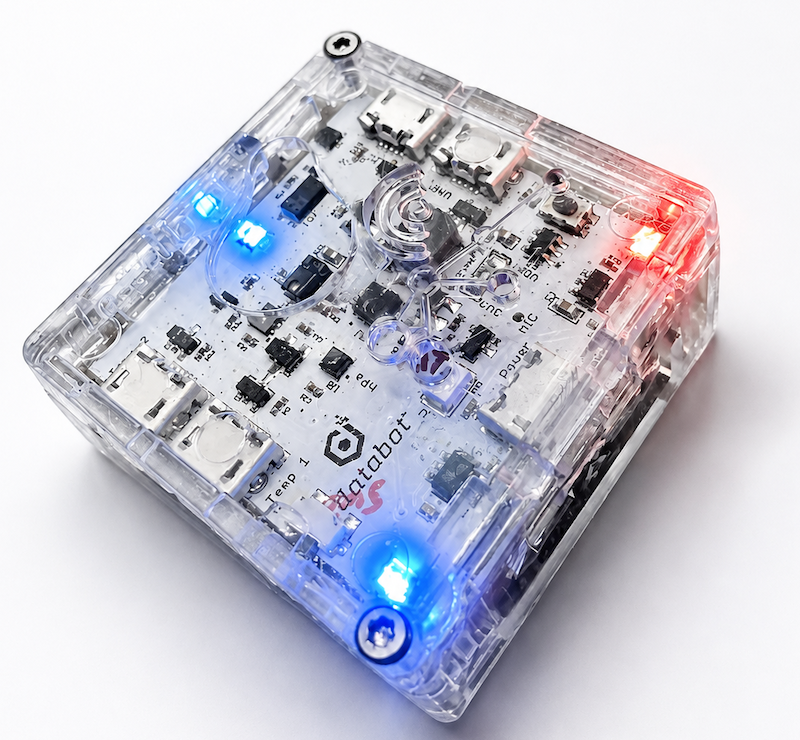
The heart of the kit — your portable sensor platform for collecting and exploring real-world data.
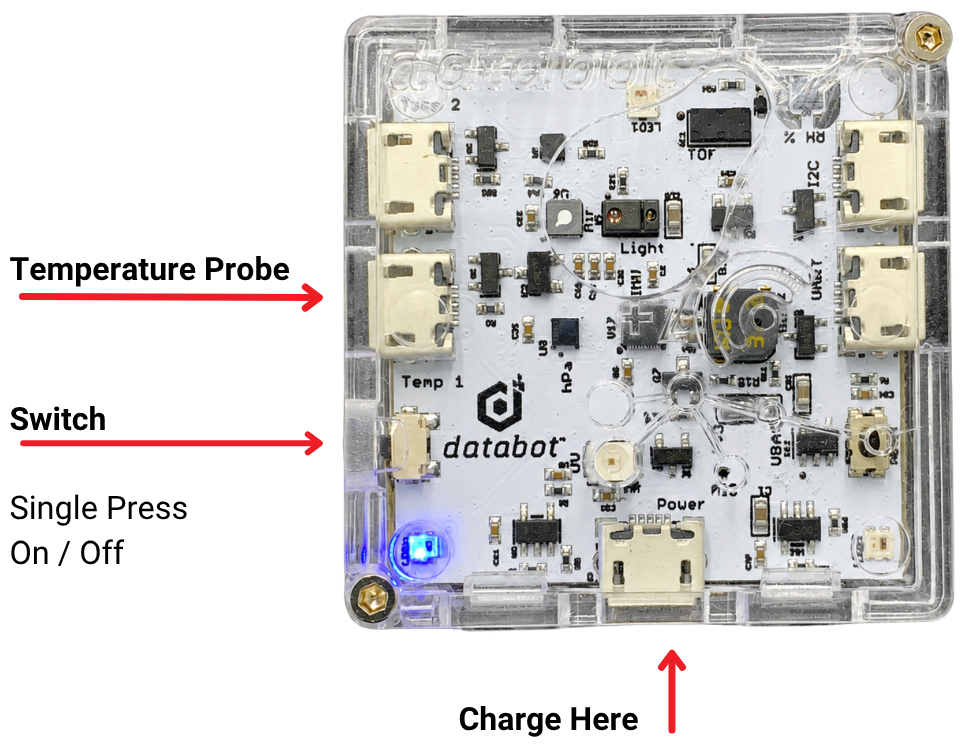
The Basics - Charging & On/Off
Databot can do a lot—but to get started, you only need to know three things:
Charge It
Use any standard 5V USB power source, such as a phone charger or laptop. Plug the Micro-USB cable into the charging port shown in the image.
About an hour of charging will give you 2-3 hours of use. You can also give Databot a quick recharge between classes if needed.
Turn It On
Press the power switch once to turn Databot on or off. The switch sits behind a small plastic plate, so it can be a little hard to spot the first time. Once you find it, it’s easy.
Where to Connect the Temperature Probe
Plug the external temperature probe into the port shown in the image when you are ready to use it.
That’s all you need for now. Next, we’ll connect Databot to your phone and start reading live data.
Meet Vizeey
Vizeey is the fastest way to get started with Databot. It runs on iOS and Android devices, as well as Chromebooks, and makes it easy to connect to Databot and begin exploring live sensor data.
In the next few minutes, you’ll:
-
Connect to your Databot
-
Capture live sensor data
-
Explore your readings in Vizeey
-
Learn how to export your data
-
Experiment and play
Vizeey is simple to use, but powerful enough that it may be the only Databot app you ever need. Later, we’ll introduce other software pathways such as CODAP and MicroBlocks. For now, the goal is quick success and learning how to manage your device.
Step 1: Install Vizeey
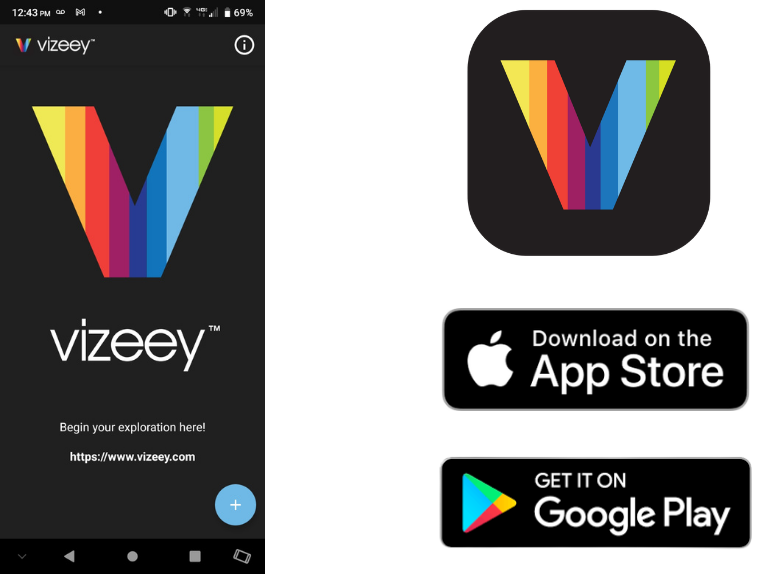
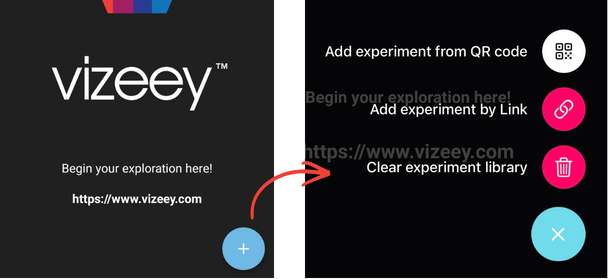
On your smartphone or tablet (IOS/Android), open the App Store or Google Play, search for Vizeey, and install the app shown here.
Once installed, open Vizeey. You should see a welcome screen similar to the one in the image.
In less than five minutes, you’ll be collecting real data from the invisible world around you.
The Experiment Manager
Step 2: Open the Experiment Manager
Tapping on the blue plus sign on your Vizeey welcome screen will open a simple menu with tools for loading experiments by QR code or link. There is also an easy option for clearing your entire library so you can start fresh with new experiments as needed.
Vizeey uses pre-configured experiments, so there’s no setup required—just load an experiment, tap to start, and begin reading data.
You can add experiments by scanning a QR code or opening links from the Vizeey library. Select the Add experiment from QR code option and go to the next step!
IMPORTANT:
- Always scan Vizeey QR Codes with Vizeey, not your camera app.
- Your Vizeey device must be connected to the Internet to access and retrieve the experiment file.
Load Experiments!
Step 3: Load Experiments
With your Vizeey QR code scanner activated:
- Scan the QR code shown here.
- When prompted to load the experiment collections, select Save All.
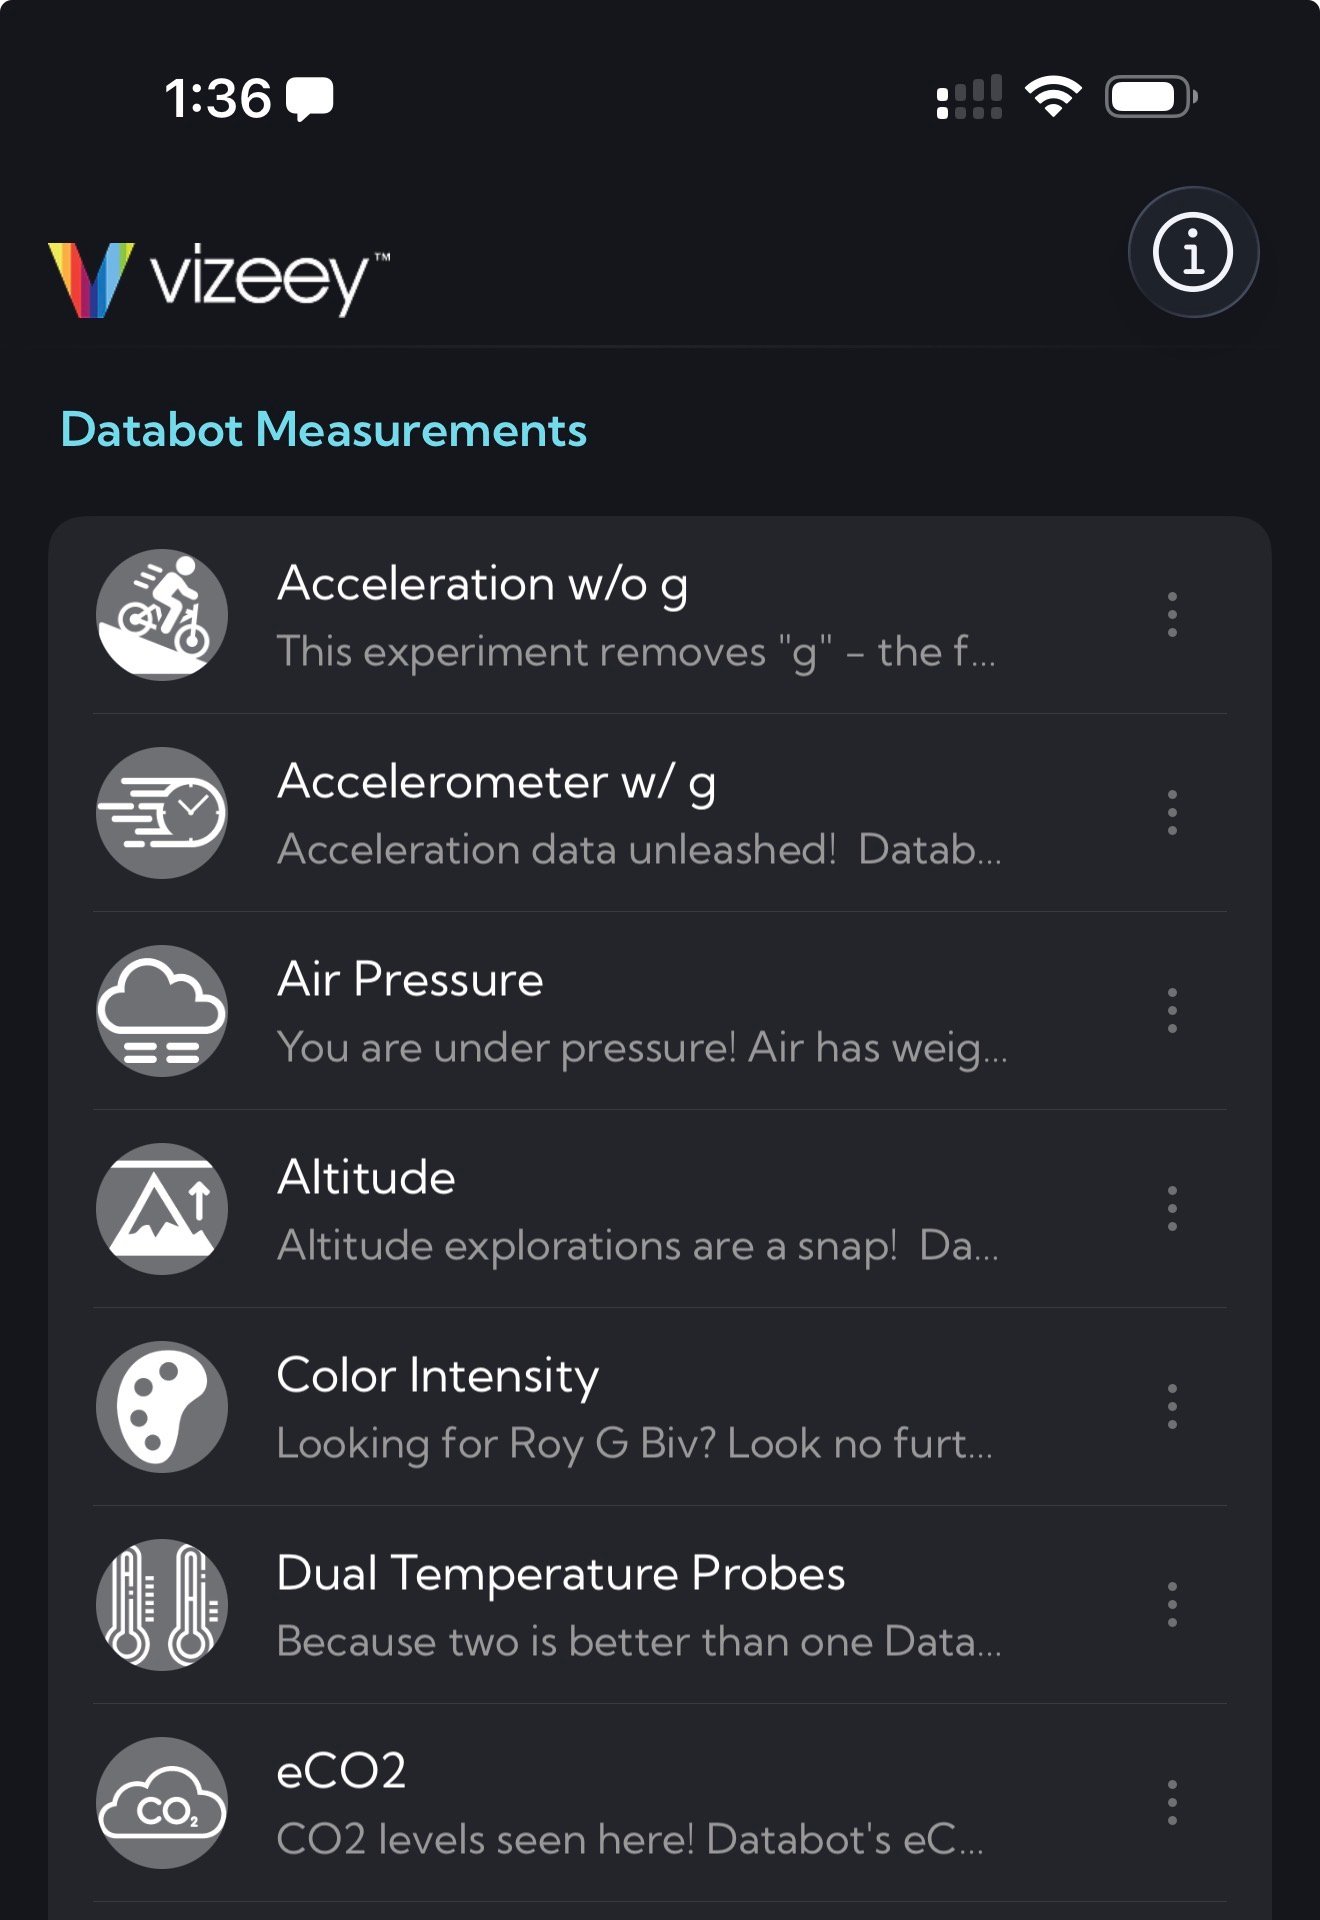
- You will see a number of icons representing experiments load into your Vizeey menu.
- That’s it—your experiments are loaded and you’re ready to start collecting data.

Read Data!
Step 4: Collect CO2 data with Vizeey
After scanning the QR code, your experiment library should appear as shown below. Now you can explore Databot’s sensors with just a tap.
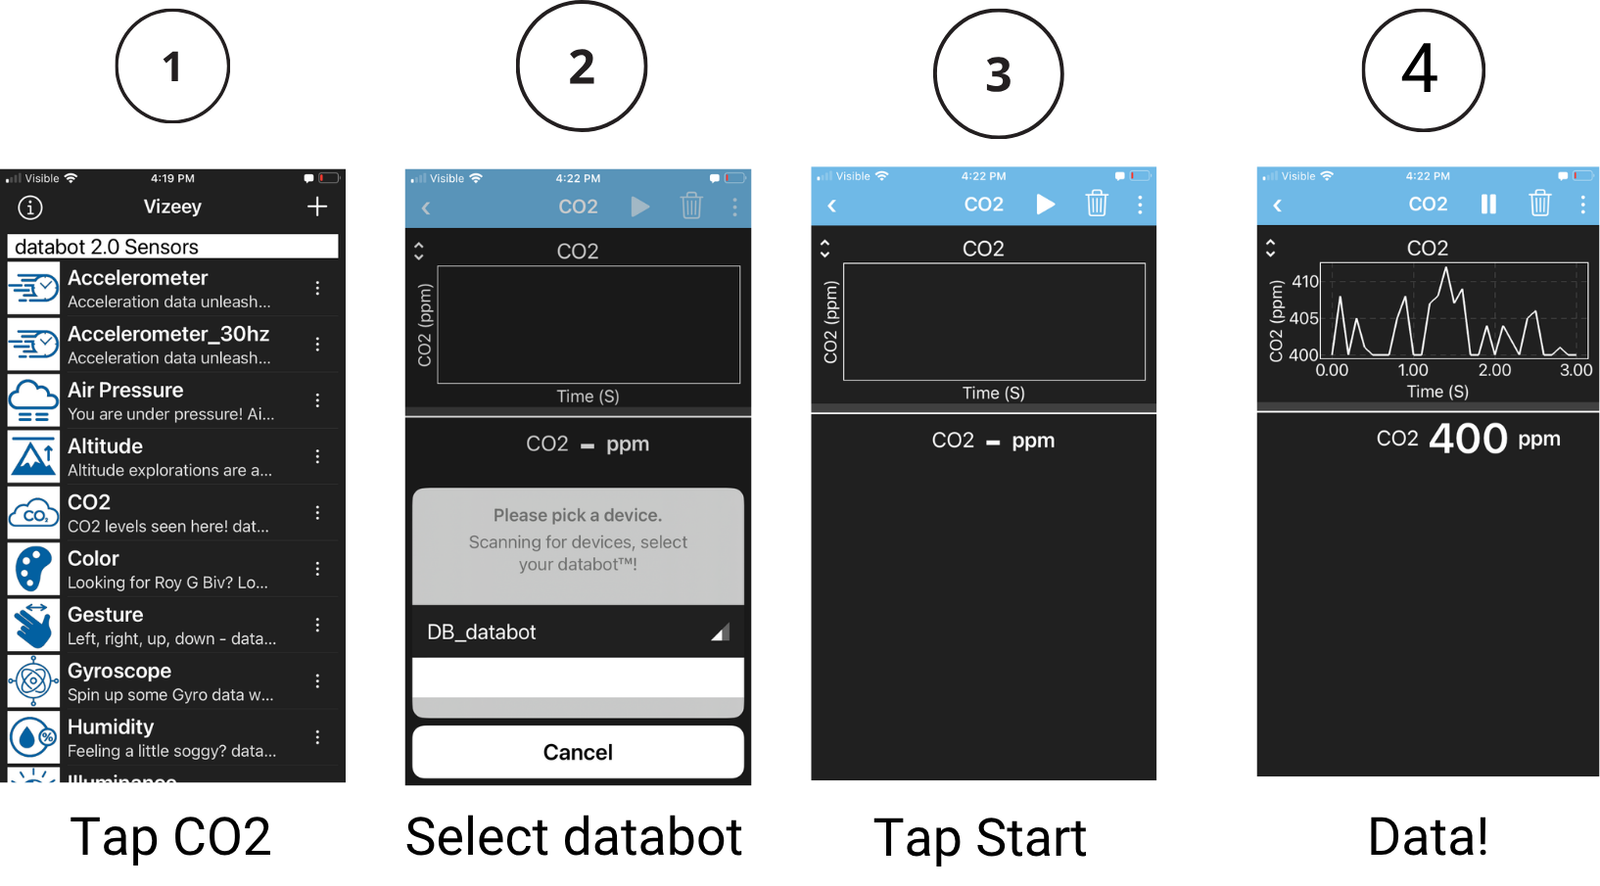
Start with CO₂:
Turn on Databot. You should see the blue light slowly pulse.
Tap the CO₂ experiment in Vizeey.
Allow Bluetooth access if prompted, then select your Databot from the pick device menu.
When connected, Databot’s blue light will turn solid bright blue.
Tap the Start ▶ button at the top of the screen.
Live CO₂ data should now appear in Vizeey.
Try it: Gently breathe toward your Databot and watch the CO₂ reading spike in real time.
Explore Your Dataset
Step 5: Learn Basic Vizeey Tools
While live data is displayed in Vizeey, you’re also recording a dataset. Exploring it is easy:
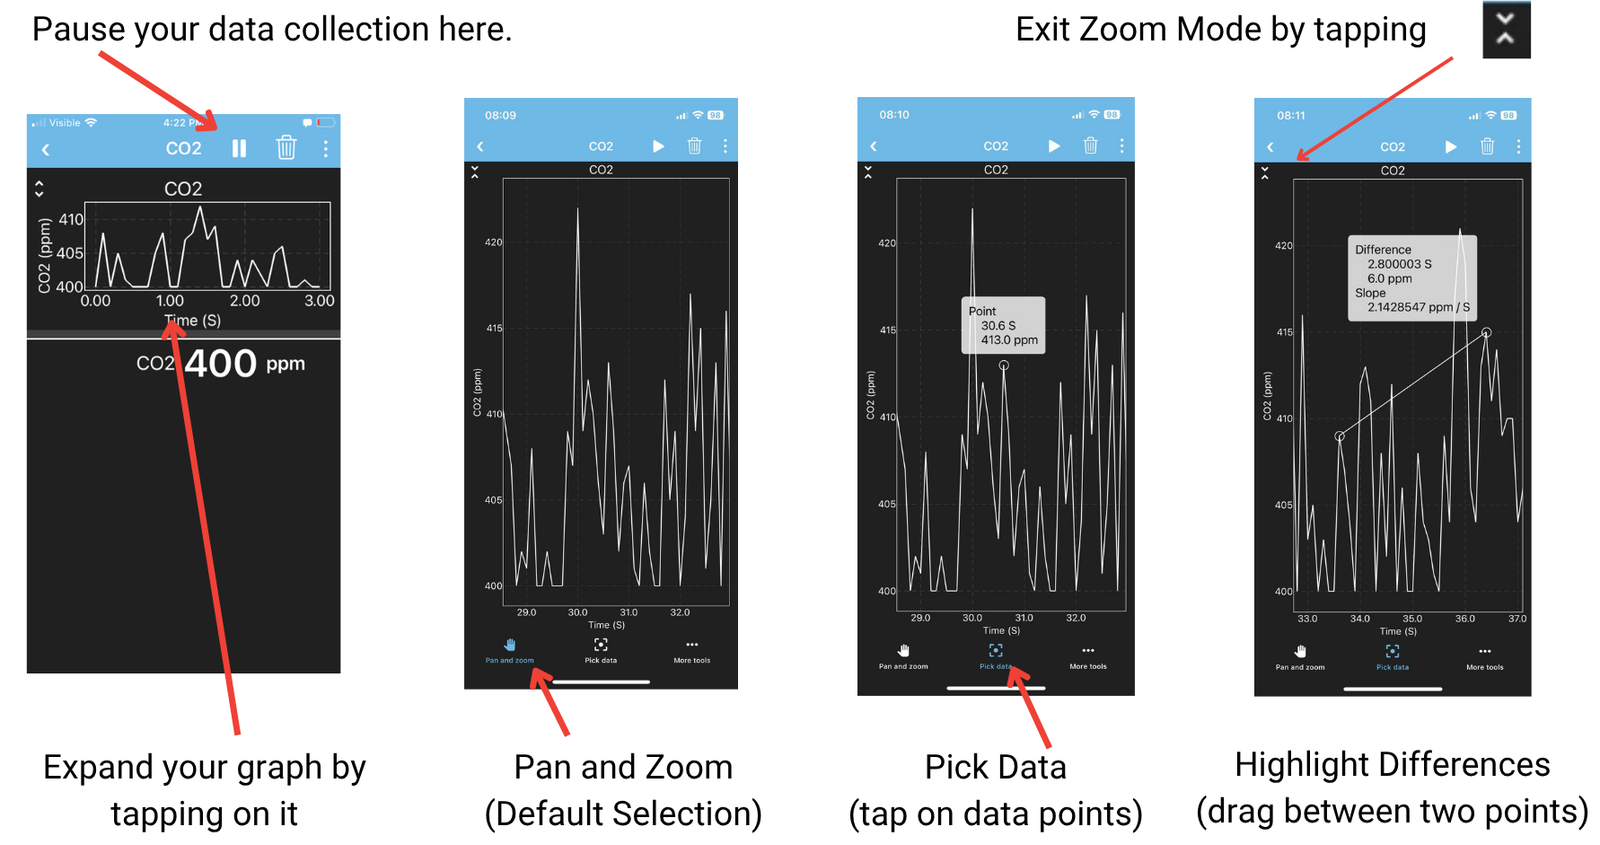
Tap Pause to stop data collection.
Tap the graph to expand it.
Modes are displayed across the bottom of the screen. In the default Pan & Zoom mode, drag with your finger to move through your data and pinch to zoom in or out.
Find the highest CO₂ reading—likely where you breathed on Databot.
Select the Pick Data mode, then tap that point to see its exact time and CO₂ value.
Drag between two points to see the difference between them.
When you’re finished exploring, tap the close icon to return to the normal view.
Export Your Dataset!
Step 6: Exporting Data
Your CO₂ data is easy to take with you – don’t exit your CO2 experiment or your data will be lost. Try this.
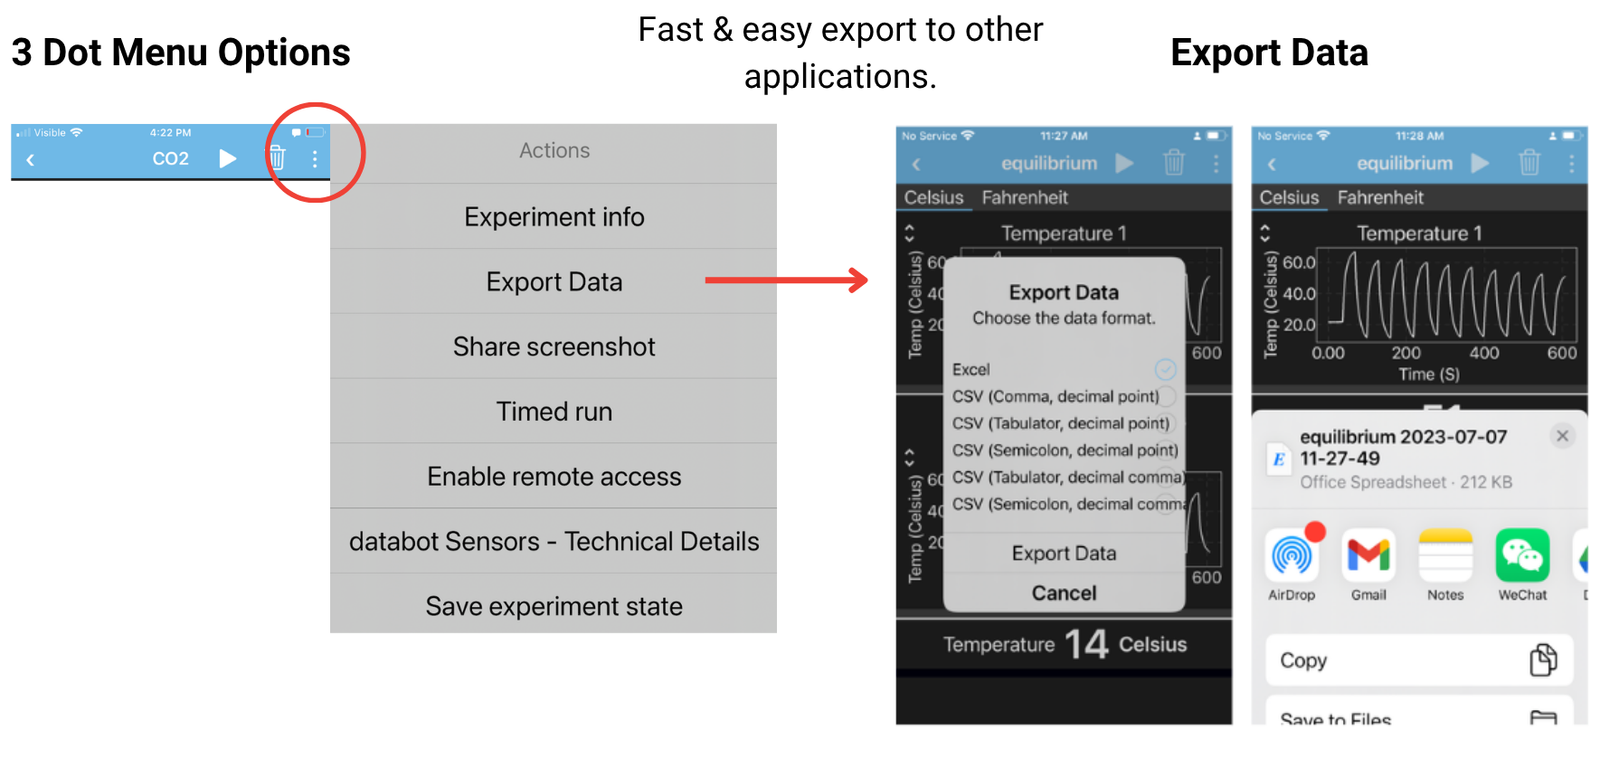
Tap the three-dot menu in the upper-right corner of Vizeey.
Select Export Data.
Choose your file format:
Excel — the default and easiest option for most users
CSV —select the first option (comma delimited) a common format that works with most spreadsheet and data tools
Tap Export Data.
Review the sharing options available on your device – email should be one of them.
Try it: Email the CO₂ dataset to yourself, then open it on your computer in Excel, Google Sheets, or your preferred spreadsheet tool.
You’ve now collected, explored, and exported real sensor data with Databot.
System Tools and Firmware - Unique IDs Recommended!
System Tools Installation
Now that you have seen how to read data, let’s make sure Databot is up to date with the latest firmware AND let’s give it a unique ID so it is easy to identify if there are several turned on in the same room. Remember how to add experiments to Vizeey? Let’s do it again.
- Select the “+” Sign on your main Vizeey welcome screen.
- Select Add experiment from QR code.
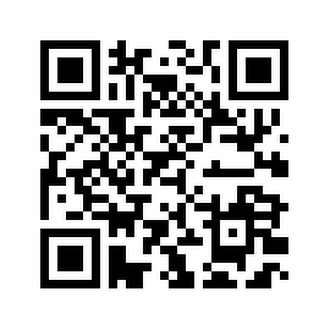
- Scan the code shown (always scan through Vizeey – your camera will not know what to do with a Vizeey QR code).
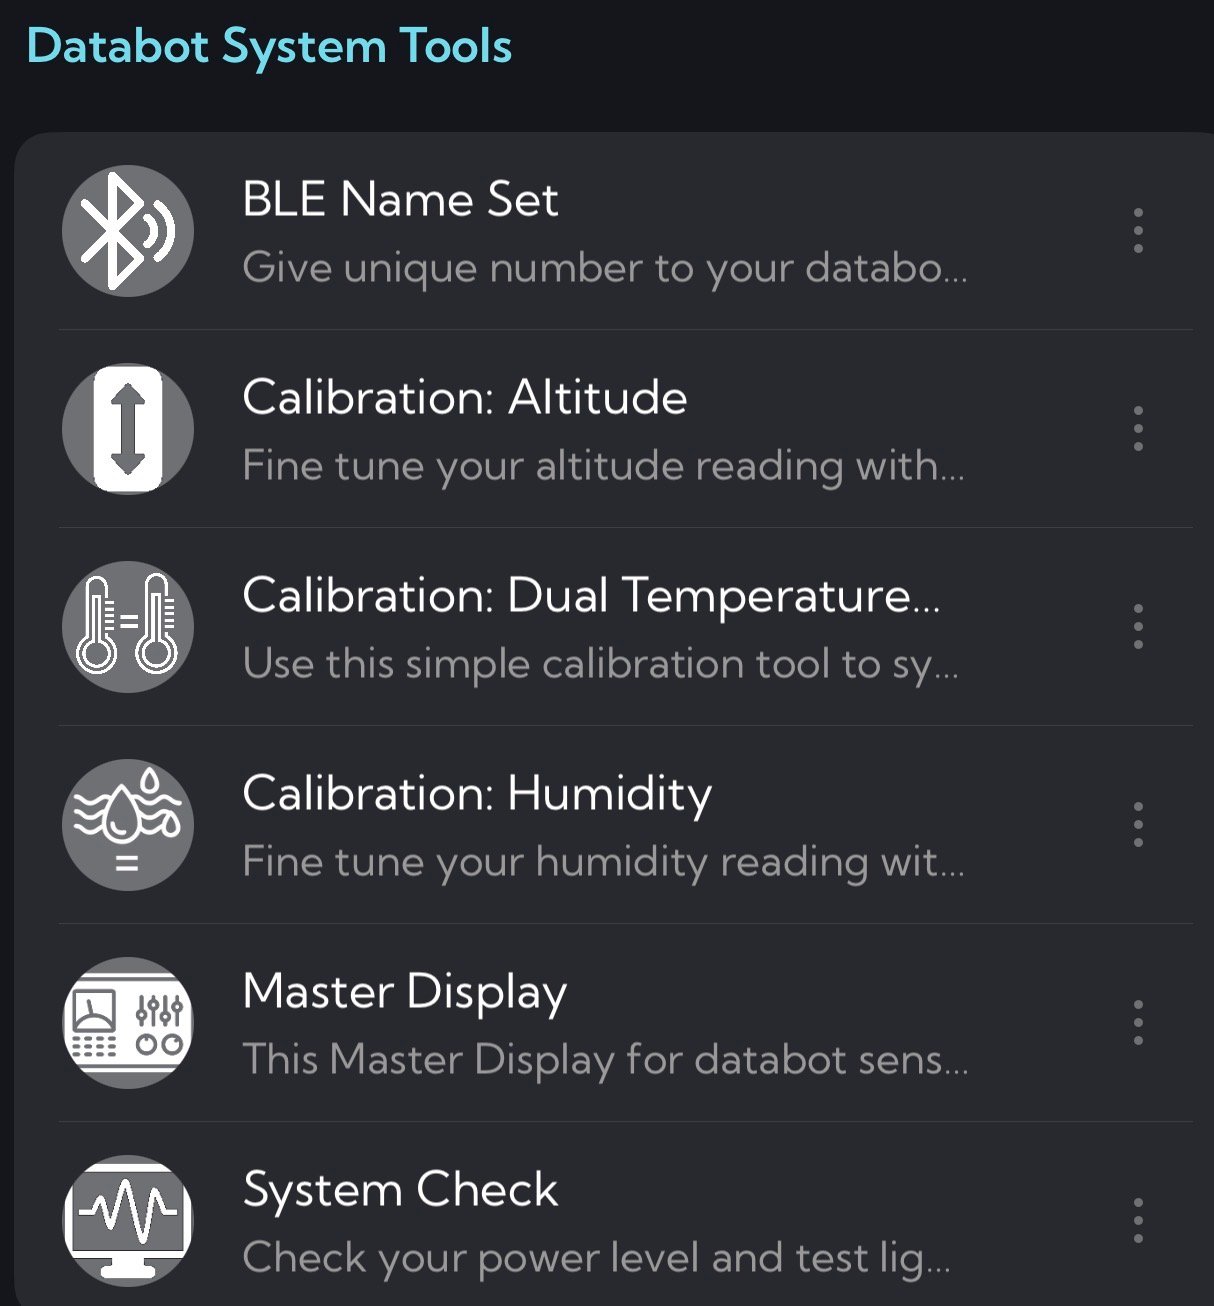
- “Save All” and you will have a new set of icons and tools on your Vizeey menu.
Giving Databot a Unique ID
Databots ship with a unique ID of “databot_1” that will display when you select an experiment and connect for the first time. You can give each Databot a unique ID number using the BLE Name Set experiment as follows.
- Select the BLE Name Set experiment.
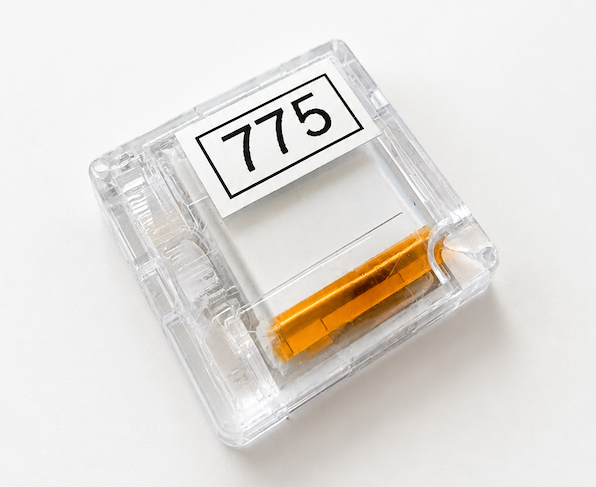
- Your connection window for Databot will appear and display its current number. In the image shown here it is 675.
- Once connected you will see a simple text box to enter your new ID number. It must be numeric only from 1 – 999 (no letters).
- Once your new number is entered into the text box tap outside of it to make sure it is accepted, then tap the Play button at the top of your screen.
- Databot will flash GREEN when you update the ID so you can see it is successful.
- Check your work. Exit the experiment and connect to another experiment – when you see the device display it should now show your new ID number.
- Place a snappy label on Databot to finish the process and make identifying the connection in a busy classroom a snap.

System Check and Firmware Version
Firmware is the set of instructions loaded into databot™s memory that defines the behavior of the device, for example using Vizeey™. With the right firmware, Databot recognizes incoming requests from Vizeey or CODAP and responds appropriately. We can easily change the behavior of Databot by changing its firmware to talk to MicroBlocks or other systems.
Team Databot regularly improves and enhances Databot firmware to add more functions and improve performance so you may need to update your firmware from time to time. When you first purchase Databot or at the beginning of the school year are both good times to check. Updating is simple and takes just a few minutes. Follow these steps.
- First, check your firmware status using the System Check experiment in System Tools as shown.
- System Check will run a quick light and sound show to check the status of your onboard LEDs and tone generator, and display current details on Databot’s status.
- Visit the Firmware update page (this link opens a separate page) and look for the Installation button which will display the latest firmware version below it.
- If your firmware version is lower than the current release, it is recommended you update. Follow the instructions on the firmware page and return here when you are finished.

Questions, Help, & Next Steps
Congratulations! You’ve completed Databot Basic Training.
In just a few minutes, you powered up Databot, connected with Vizeey, collected and worked with some live sensor data, and have learned some important device management skills. Important next steps!
- Need help or is something not clear? Use the Contact Form and reach out, we’re here to help.
- Regardless of the software you end up using for your Databot programs, use Vizeey to manage devices when assigning IDs and checking firmware.
- The next step in your Databot journey is to determine how you will be using Databot and what tools are best suited for you. Databot is used for teaching KG science, advanced computer science topics, and everything in between. Head over to the Software Options and Pathways page to help you decide your next steps.
Again, welcome to the Databot Family! We appreciate you joining us, onward!