databot™ Basic Training starts here, welcome to Team databot™!
Bot Basics!
databot™ Basic Training
databot™ Meets Science Journal!
databot™ is a multi-faceted ‘bot that is able to interact with many different programs. Google Science Journal is one and it totally ROCKS building an interactive science portfolio. See how to hook up with Science Journal below.
What is Science Journal?

 Science Journal from Google is an easy-to-use digital notebook that you can use to view, record, analyze and share your databot™ data in a cool digital journal! Follow these steps to configure databot™ to work with Google Science Journal (SJ) using an Android Smart Phone, Android Tablet, or Chromebook.
- If you received your databot prior to April, 2020, it was pre-configured to work with Google Science Journal so jump to the install instructions below.
- If you received your databot beginning in April of 2020, it is pre-configured to work with Phyphox – another awesome app. To configure databot™ to “speak” Science Journal instead of Phyphox, follow the steps using Arduino software by clicking here. After configuring databot™ for Science Journal return to the installation steps below!
Install Google Science Journal - Step 1
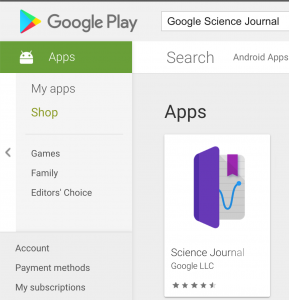
Go to your Google Play Store and search for Science Journal. Install Google Science Journal.
Install aRduino Link - Step 2
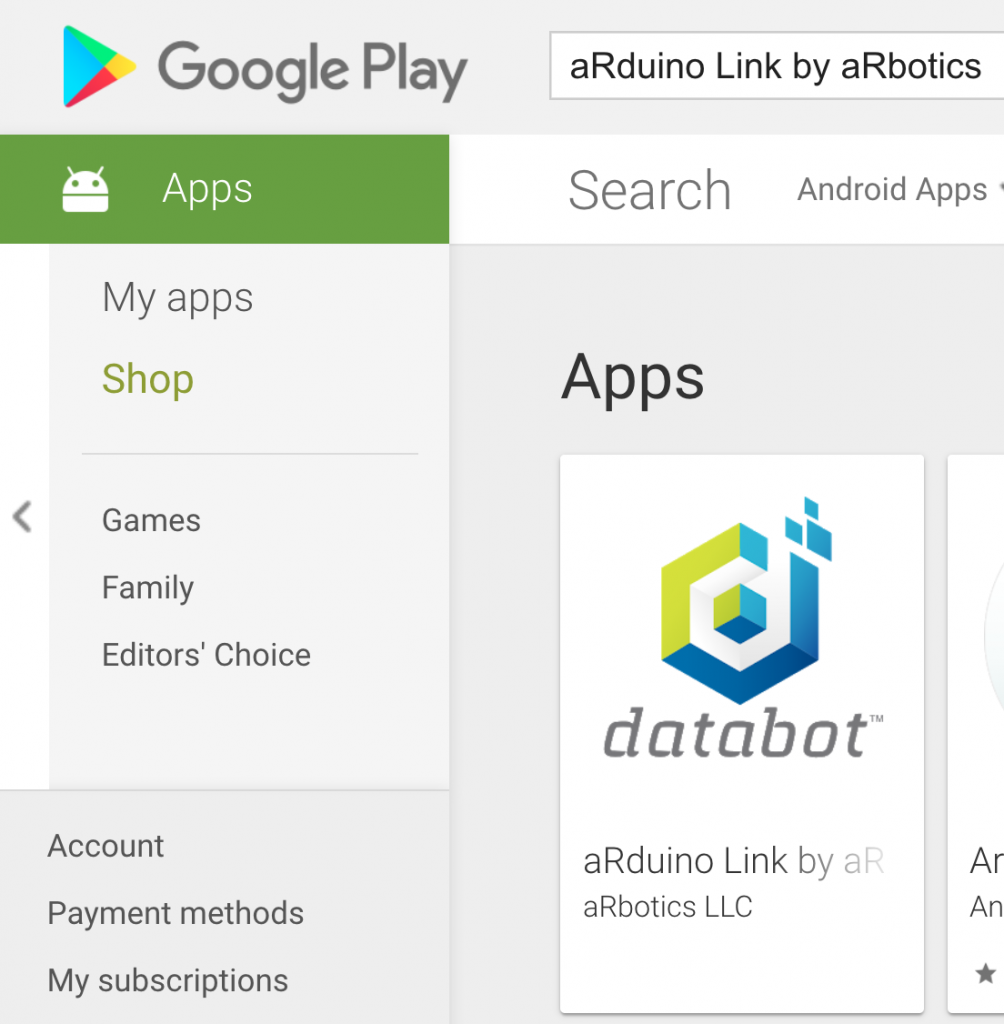
Next, search the Google Play Store for the linking app that enables databot™ to talk to Science Journal. It’s called aRduino Link by aRbotics. aRbotics is the company that brings you databot™! Your search should turn up the app as shown here. Download and install aRduino Link.
Connect to databot™ - Step 3
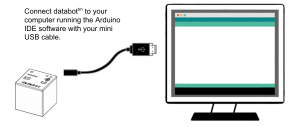
Step 3. Prepare databot™ to get to work! You will need to upload a sketch to databot™ to gather data for your Science Journal experiment. If you’ve not read how to upload sketches to databot™ yet through the Arduino IDE you need to go through the Arduino IDE tutorial and setup your software.
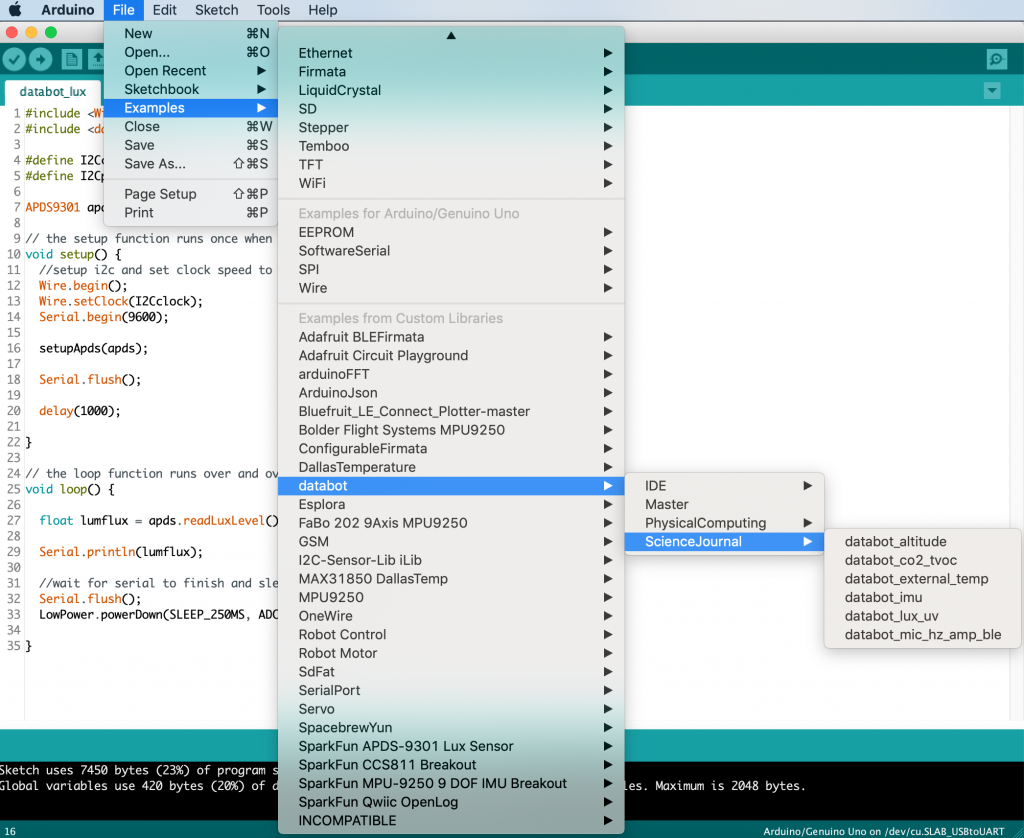
Take a look at the databot™ Example folder labeled Science Journal. These sketches have been authored specifically to work with Science Journal. From the sketches listed, select the one named databot_lux_uv. This one provides the sensor data for ambient light intensity and ultraviolet light.
Upload the sketch to your databot™ and let’s test out aRduino Link!
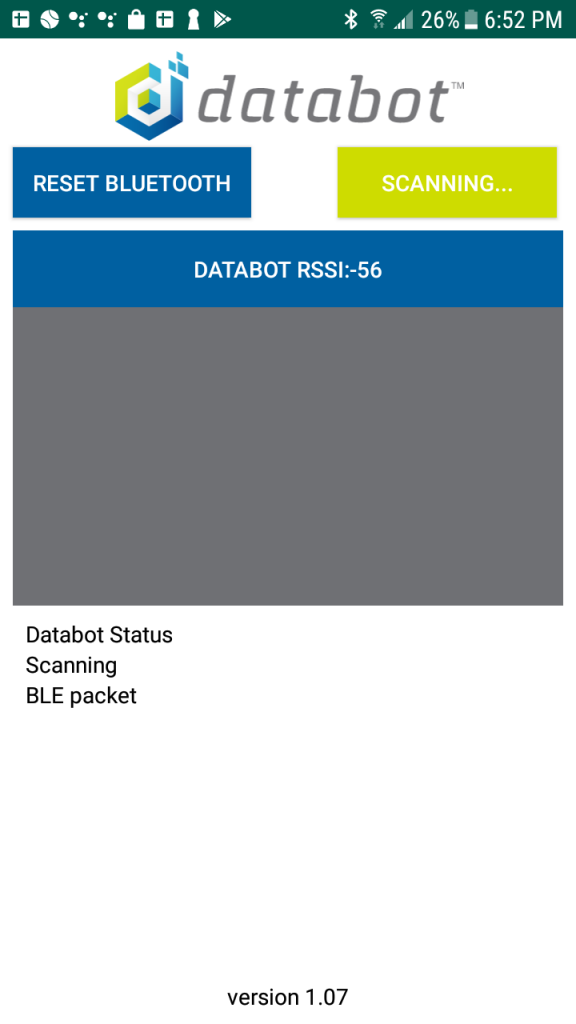 With your databot™ fully charged and turned on you can now connect databot to the aRduino Link app. Look closely at databot™’s BLE board in the back of the cube, you should see a blue light flashing. This means that databot™ is available to connect. You will see the light turn a solid blue in a minute when you connect.
1. Run your aRduino Link app on your Android device. You should see something like this image.
2. Look at the green button labeled SCANNING... This means aRduino Link is looking for databot™!
3. The display window below SCANNING will show all databot™’s nearby. In this case, there is only one, showing as DATABOT followed by it’s signal strength. If you see more than one databot in the list place your databot right next to your device as the closest databot should be displayed at the top of the list. Click on the device and you will connect. The flashing blue light on your databot™ should turn solid blue.
Note: The RESET BLUETOOTH button is used if you are having problems connecting or seeing your databot™. It will turn your device bluetooth off, and on again. After the reset it will resume scanning. A reset will usually solve any problems connecting.
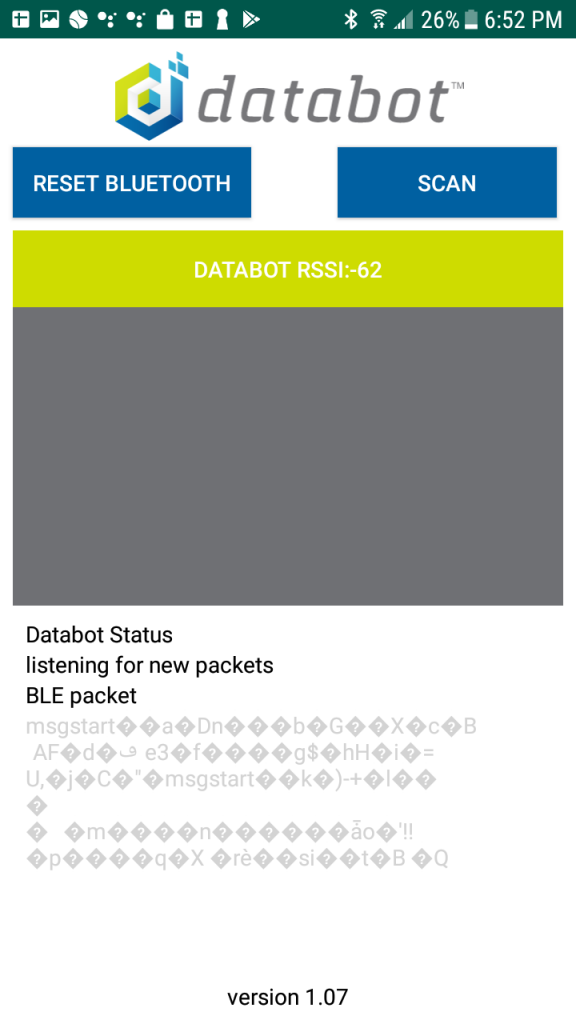
4. After connecting, this is what your app will look like. The selected databot™ in the list will turn green and you will see a moving indicator of data beneath the display window that shows your connection to databot™ is working.
Leave aRduino Link running and now run your Science Journal app.
Science Journal and databot™ - Step 4
With aRduino Link installed and running databot™ is now sending data for Science Journal to display, record, etc.
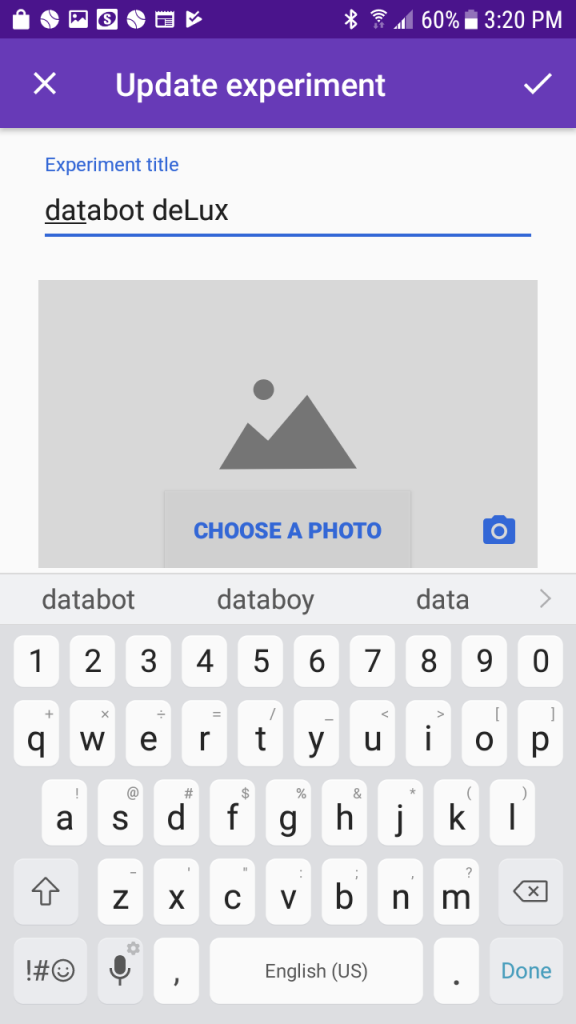
Run Science Journal and click the + sign to create a new experiment. Give your experiment an interesting name by editing the title (click on the pencil icon to edit) and then select the check mark to save it.
You can also use your device camera to take a picture and add to your portfolio, or choose a photo stored on your device.

After saving your newly titled experiment, from the experiment dashboard, select the sensor icon from the display. It looks like a circle with a wavy line (data) being displayed in it.

By default, Science Journal will open up a new experiment with the sound intensity sensor from your smart device selected and displaying data. Science Journal requires one internal sensor to be active at all times, so leave the Sound intensity display running.
Select the Gear Wheel on this display card and it will open the Sensor Settings menu.
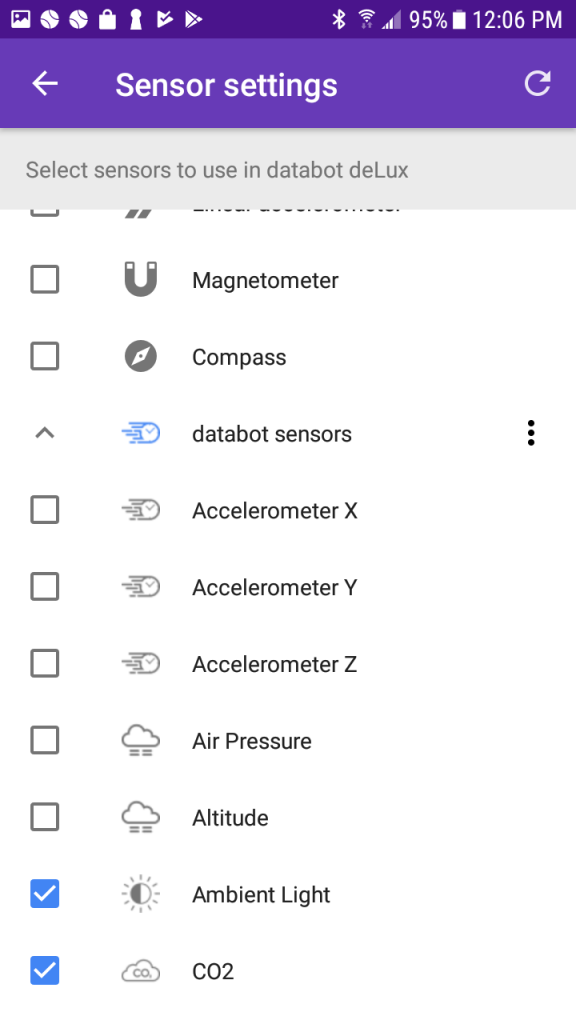
In the Sensor Settings menu, you will see a list of sensors displayed, both internal and any external (like databot) sensors will be displayed.
Uncheck the internal sensors, leave the sound intensity sensor, then select the Ambient Light and CO2 sensors. This will make them available now within Science Journal.

You can now hit the “back” arrow in the Sensor Settings menu. This will take you back to the active sensor card showing Sound Intensity.
Select the + sign immediately beneath the card. It will add and display the lux sensor displaying ambient light in units of lux. One lux is equivalent to one lumen per square meter.
Congratulations! You are now reading a live data feed from databot™ in Science Journal! Put your hand over the front of the databot™ and watch the lux measurement change as you block the sensor.
Select the + sign again, it will add the next sensor card, CO2. You can display the data from selected sensors all at once if you desire or close individual cards. Breathe on databot™ and watch the CO2 levels increase to test the sensor.
Tips:
You may find you need to refresh Google Science Journal’s data display occasionally by closing and re-opening the display card.
You can do a deeper refresh by going to the sensor list and selecting the “forget device” next to the databot™ device, then selecting it again from the list of available devices.
As a final refresh, stop and restart the aRduino Link application if you continue to have problems with your data display.
