
Meet CODAP!
Welcome to Databot + CODAP
CODAP — the Common Online Data Analysis Platform — is a free, web-based environment designed to make powerful data analysis accessible to students and educators. It is a project of the Concord Consortium, a nonprofit research and development organization with a long history of creating innovative STEM tools and resources for K–12 education. CODAP itself is designed for student learning and is used across science, mathematics, data science, and other subjects.
CODAP is easy enough to begin using in minutes, but there is remarkable depth beneath the surface. From the CODAP website – students can:
- Build and explore graphs, tables, and linked visualizations
- Work with maps and geographic data
- Calculate new variables with formulas and functions
- Explore statistics, distributions, relationships, and trends
- Join datasets using shared attributes
- Organize and analyze hierarchical data
- Import and investigate datasets from many different sources
- Move fluidly between individual data points, tables, graphs, and maps to discover patterns and tell a data story
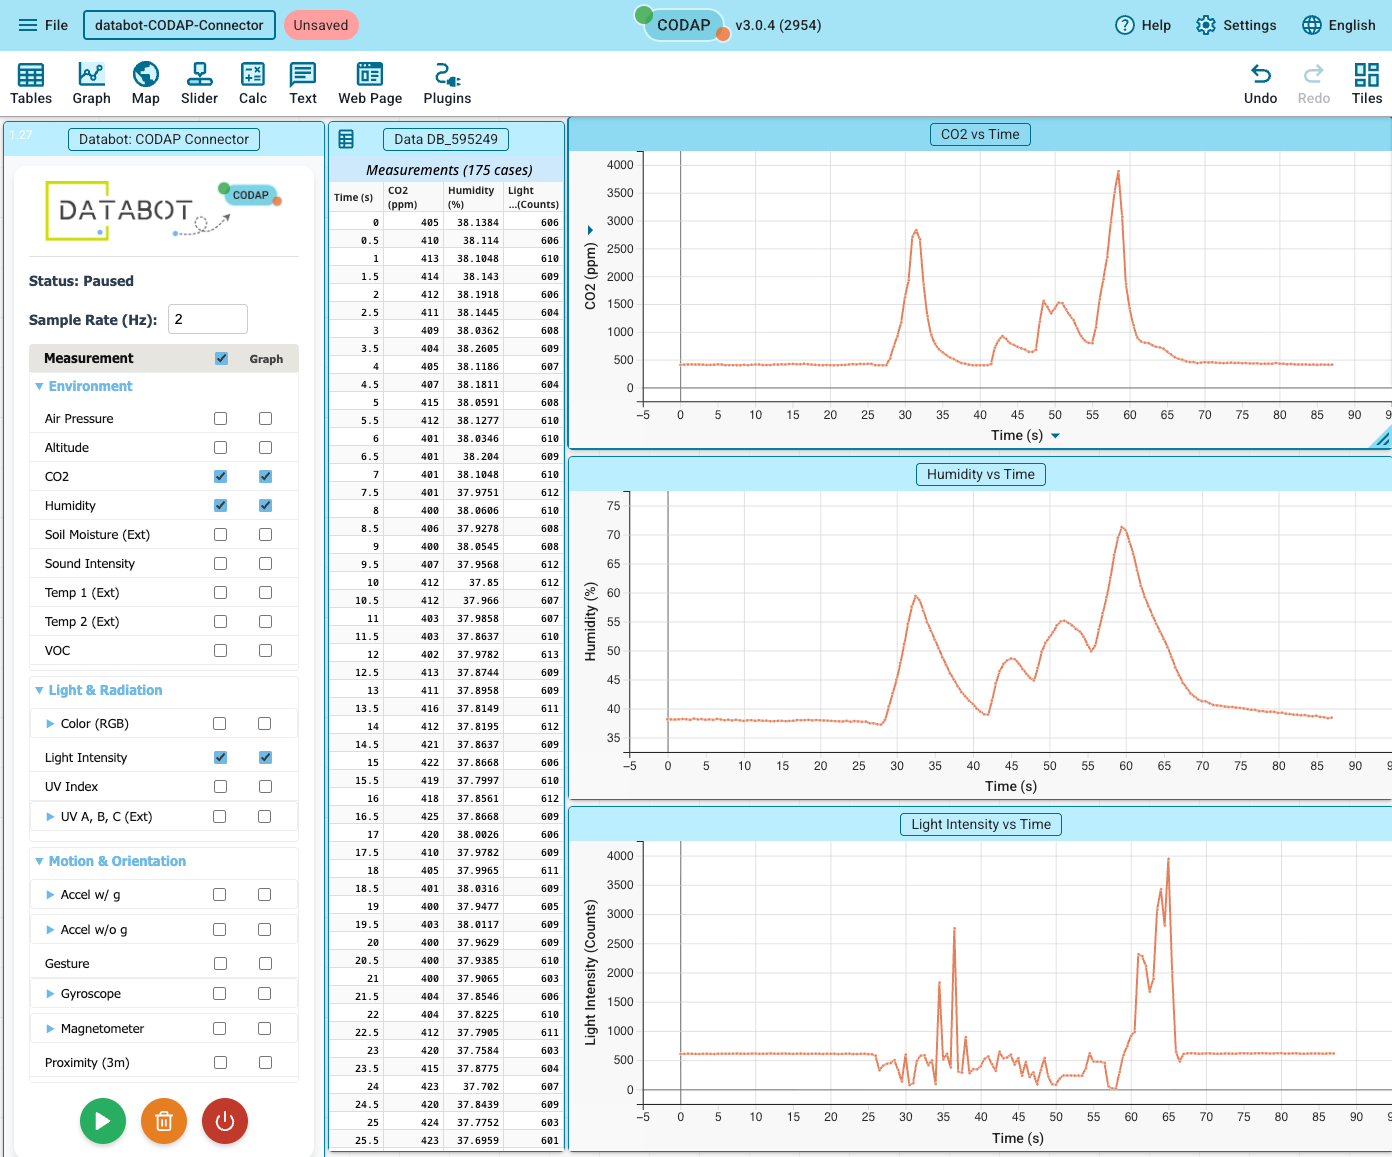
It’s also very IT-friendly. CODAP runs in a web browser, works well on desktops and Chromebooks, and requires no CODAP account or login for normal use. When used through the main CODAP web application without optional third-party services, Concord states that it does not collect the personal information described in its privacy policy. (CODAP)
And CODAP does not require a Databot. It can stand alone as a data-analysis environment, working with datasets from many sources—including data collected previously with Vizeey or MicroBlocks.
For this Quick Start, however, we’re going to connect CODAP directly to Databot.
In just a few minutes, you’ll load the Databot CODAP Connector, connect to your Databot, collect live sensor data, create your first visualization, and try a few basic analysis tools.
From there, we’ll point you toward experiments and resources that let you take CODAP much deeper.
Ready? Let’s bring live Databot data into CODAP.
Databot-CODAP Connector
Step 1: Load CODAP with the Databot Connector
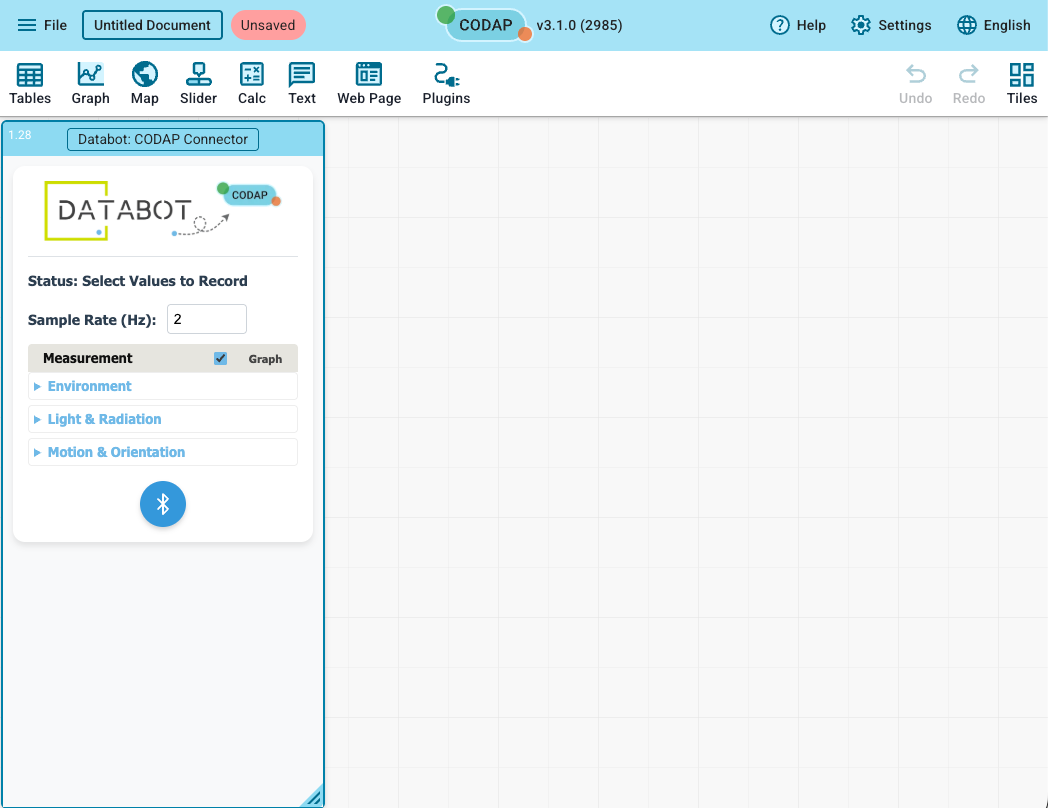
When CODAP opens by itself, you’ll see a blank workspace ready for data.
CODAP also supports plugins that add new capabilities. The Databot CODAP Connector is the plugin that lets CODAP connect directly to your Databot and stream live sensor data.
Click here to launch CODAP with the Databot Connector already loaded.
IMPORTANT: For live Bluetooth connection to Databot, make sure you use Chrome or Edge.
Once CODAP opens – it should like the image shown here – take a moment to explore the connector. Open the drop-down menus to browse the available Databot sensors and collection options.
That’s all you need for now.
Next, let’s connect your Databot and do a quick test!
Step 2: Connecting to Databot
Now let’s connect Databot to CODAP and do a quick test to learn the CODAP experiment controls.
The connection process is simple:
- Turn on Databot
- Set the sample rate
- Choose your sensor
- Turn graphing on or off
- Connect
- Start data collection and use the experiment controls as desired
Watch the video to see these steps in real time and to learn the basic experiment controls while you take a CO2 sample and graph the results.
When you finish you are ready to proceed to a fun experiment where you will learn more about CODAP capabilities. Read on!
Step 3: An Experiment to Learn CODAP Basics
Now that you are trained and ready to connect and collect data with Databot, this short video introduces several of CODAP’s core tools for data analysis.
Watch the following video and you’ll see how to:
- Connect Databot to CODAP
- Start live data collection
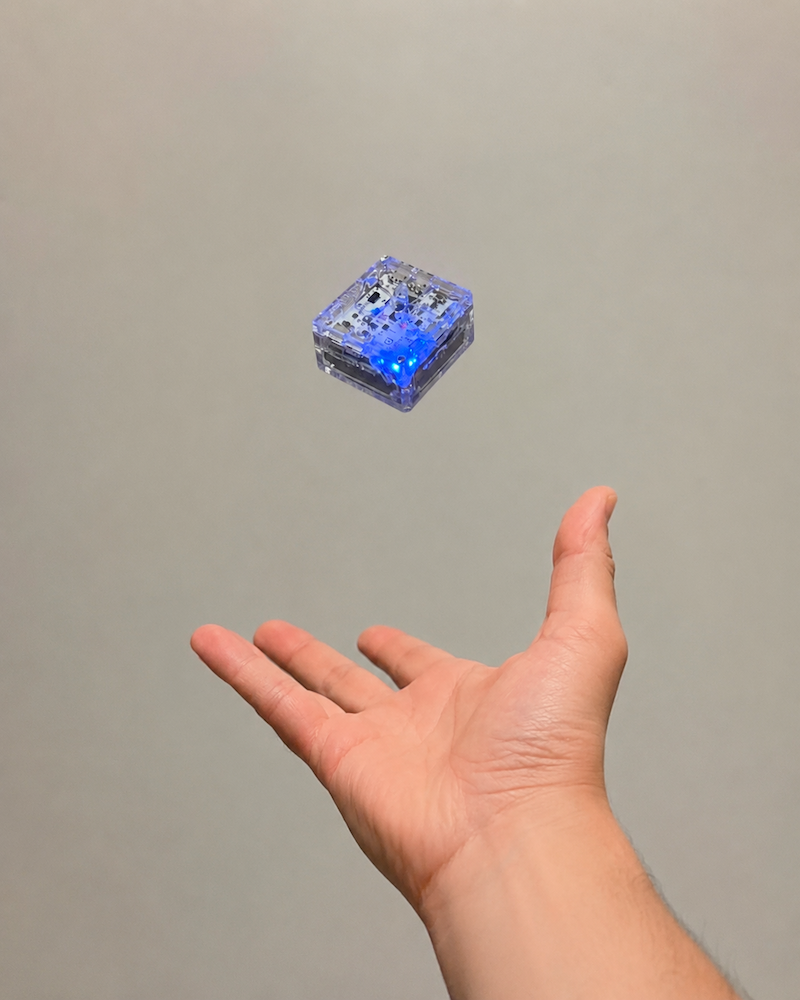
- Conduct a simple motion experiment of tossing Databot into the air
- Stop the collection
- Expand and explore your graph
- Highlight individual data points
- Select sections of data for closer analysis
Preparation
For the experiment you will toss Databot into the air and catch it three or four times so practice. Put something soft beneath where you are tossing in case you drop it (it’s tough but be safe).
Remember you can use the Pause and “trash” icons to clear your dataset and restart a number of times while you practice. Take your time and have fun.
Although a very simple action, the resulting graph clearly shows three phases of motion for some intriguing analysis:
- The toss — Databot accelerates upward.
- Freefall — the acceleration reading settles into a distinct region during the airborne portion of the motion.
- The catch — acceleration changes sharply as Databot returns to your hand.
Use CODAP’s highlighting, selection, and graphing tools to isolate a section of data (one instance of the three-phase phenomenon), identify each phase and investigate what the data is telling you.
Where to Go Next!
That’s the basic Databot-to-CODAP workflow: choose your sensors, collect live data, visualize it, and start asking questions.
From here, CODAP opens the door to much deeper investigations in physics, environmental science, mathematics, data science, and more.
- Download a curriculum sample and try out our new Acceleration Sensor Starter with CODAP.
- Keep experimenting with your Databot. Change a variable, collect another dataset, and see what you can discover with easy access to a multitude of measurements and powerful analysis tools!
Don’t have a Databot?! Head over to the Databot shop and get one on the way.