
databot™ Sensor

System Tools


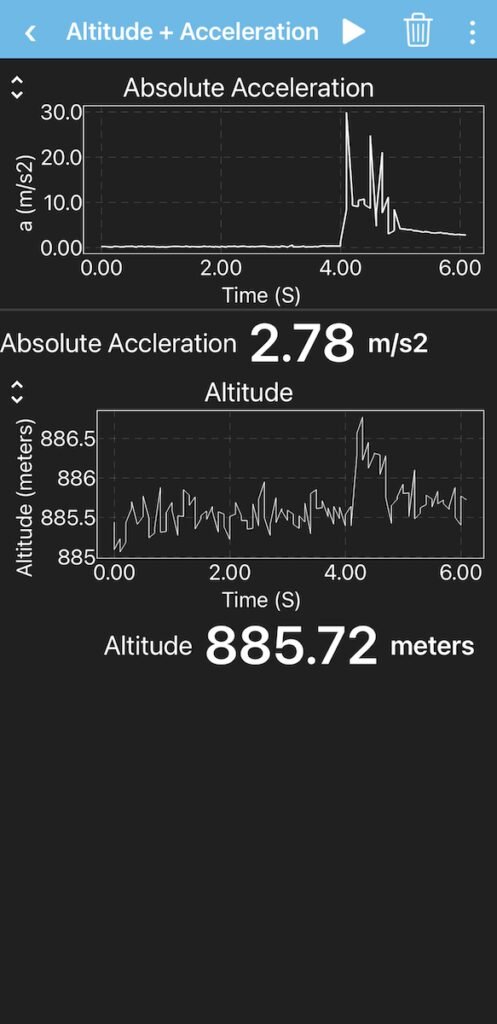
Altitude + Acceleration

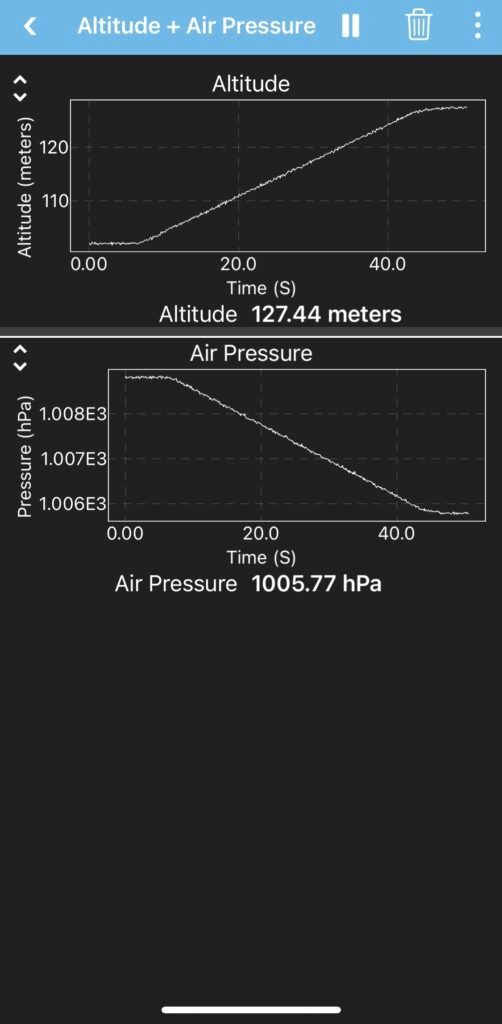
Altitude + Air Pressure

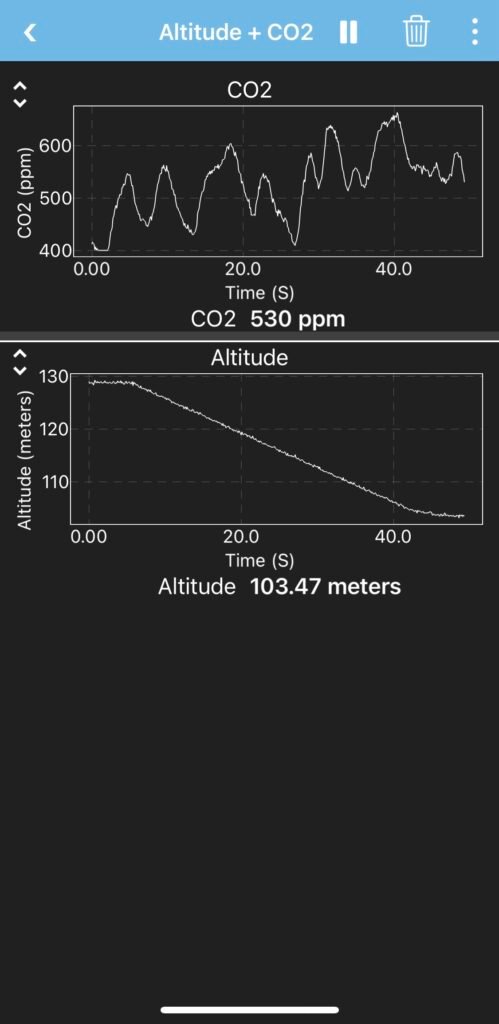
Altitude + CO2

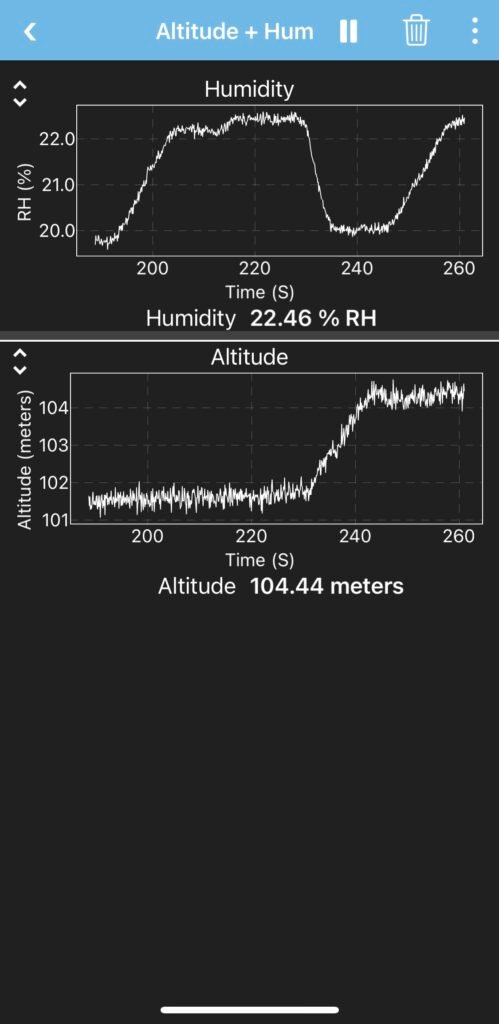
Altitude + Humidity

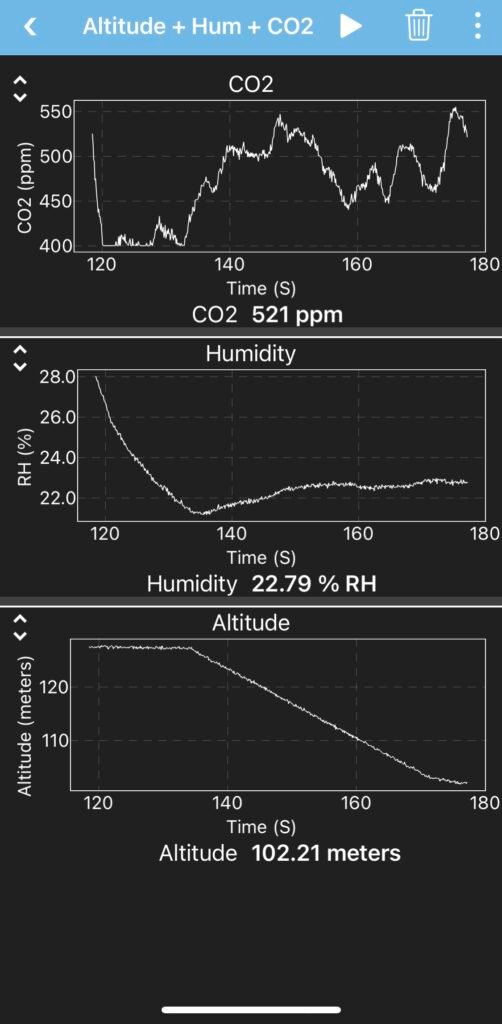
Altitude + CO2 + Humidity

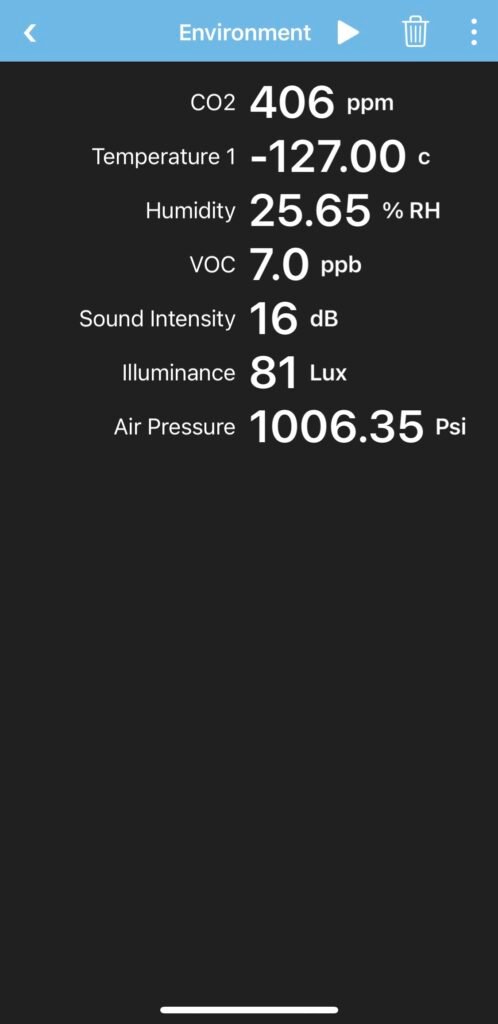
Environmental: Light + Sound + Humidity + Temperature + CO2 + VOC + Pressure

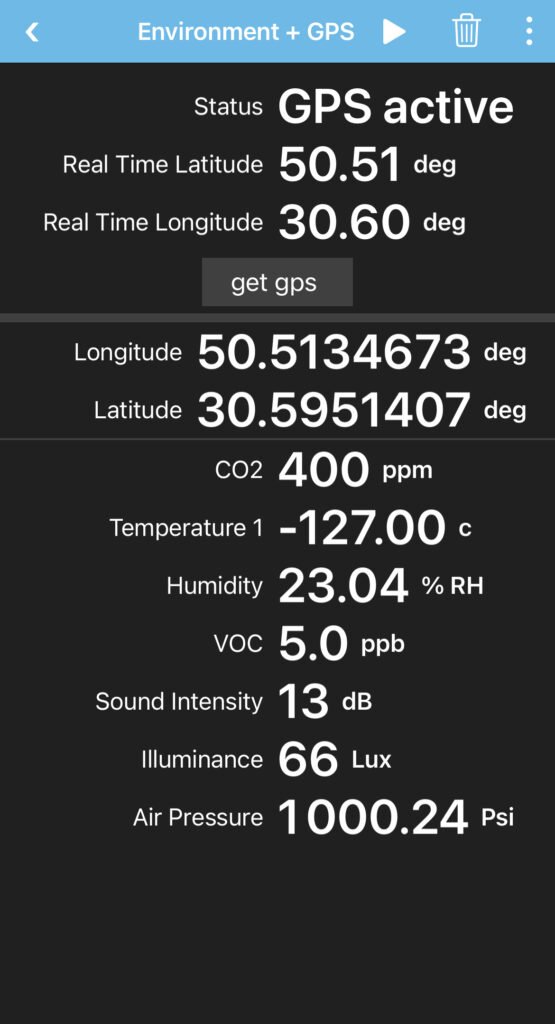
Environmental: Light + Sound + Humidity + Temperature + CO2 + VOC + Pressure + GPS

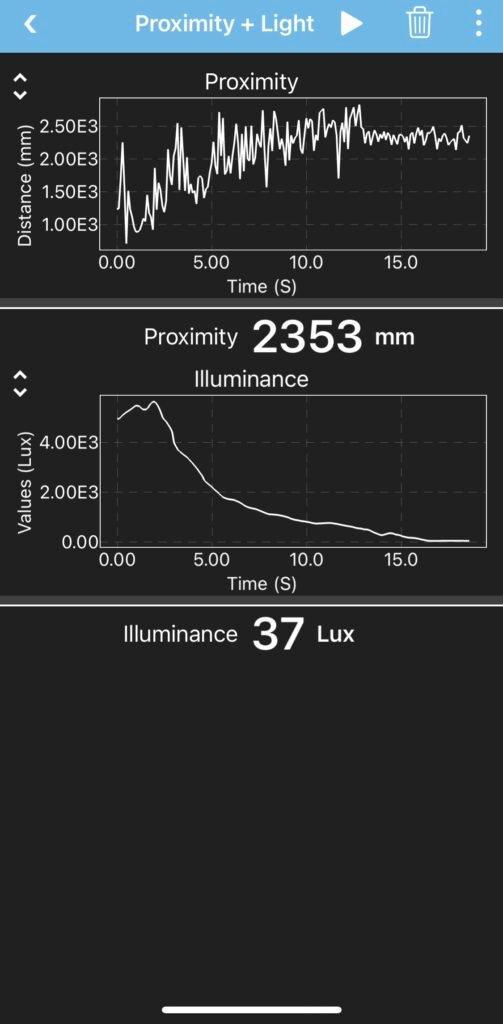
Light + Proximity

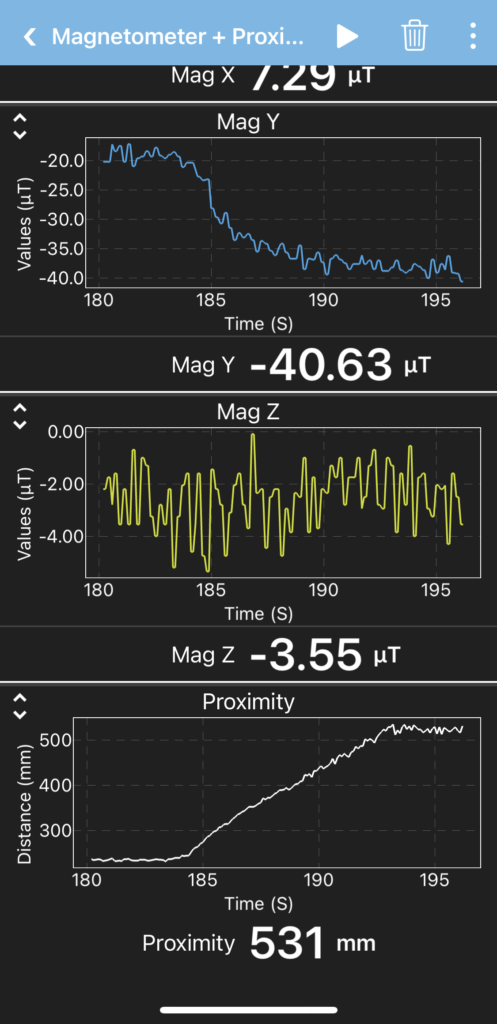
Magnetometer + Proximity

Sound + Proximity

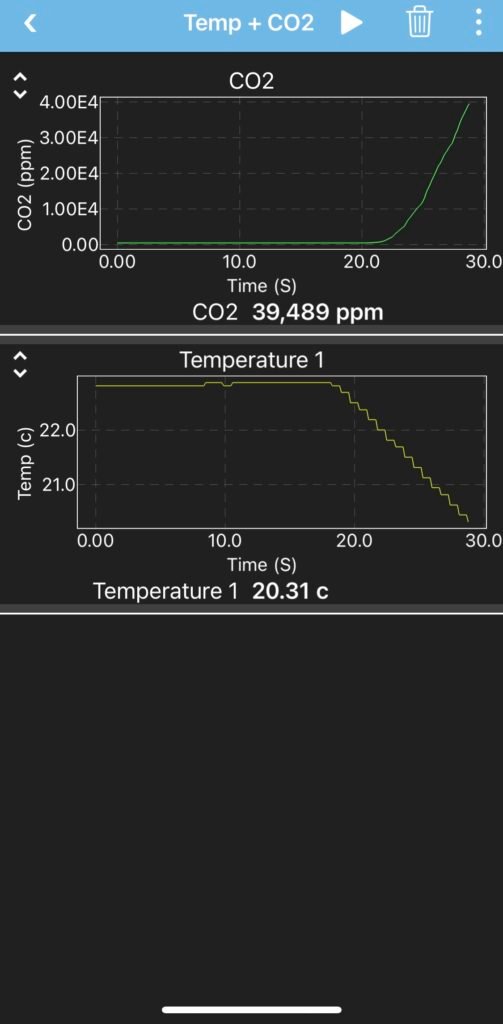
Temperature + CO2

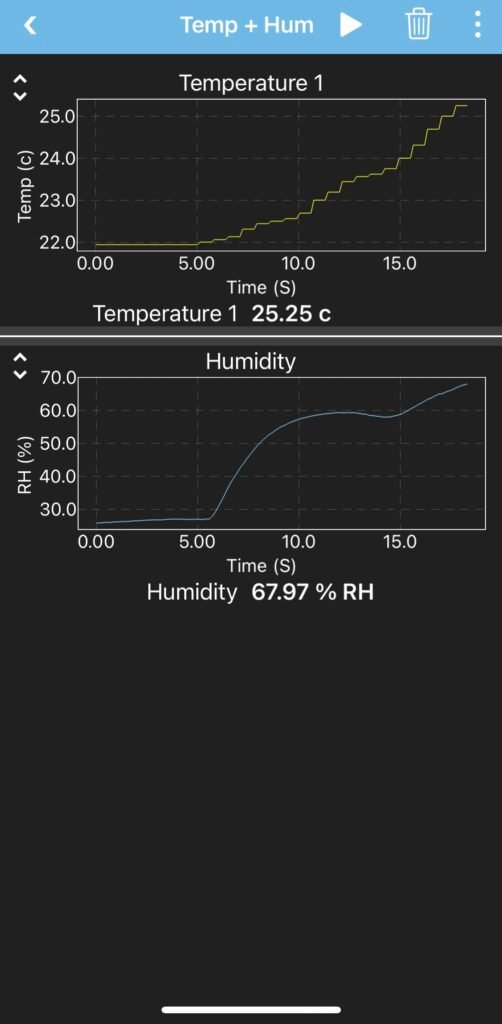
Temperature + Humidity

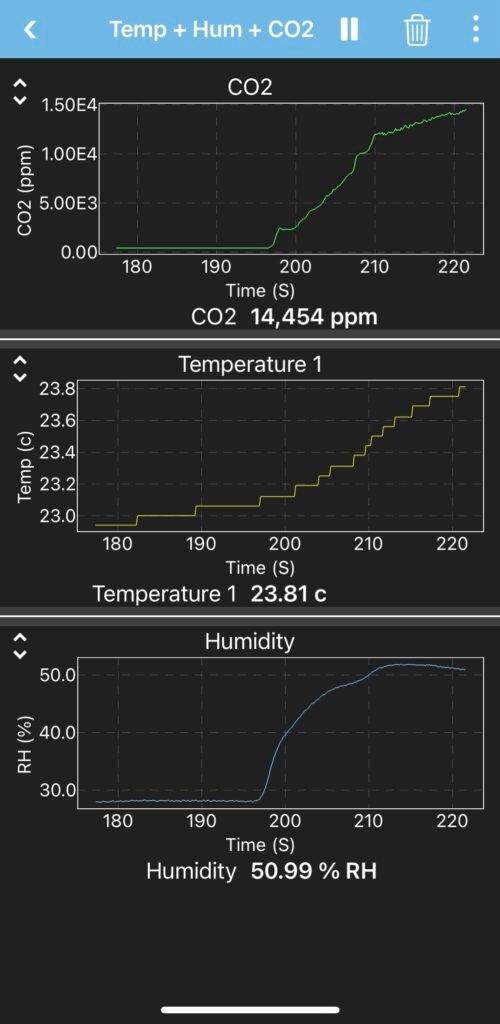
Temperature + Humidity + CO2

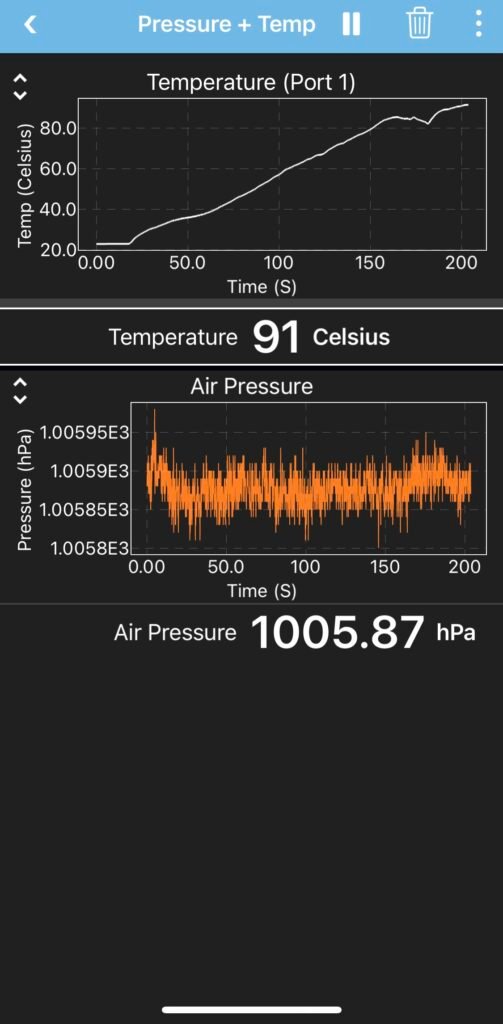
Temperature + Pressure

Z Axis Acceleration + Proximity

External Sensor Experiments


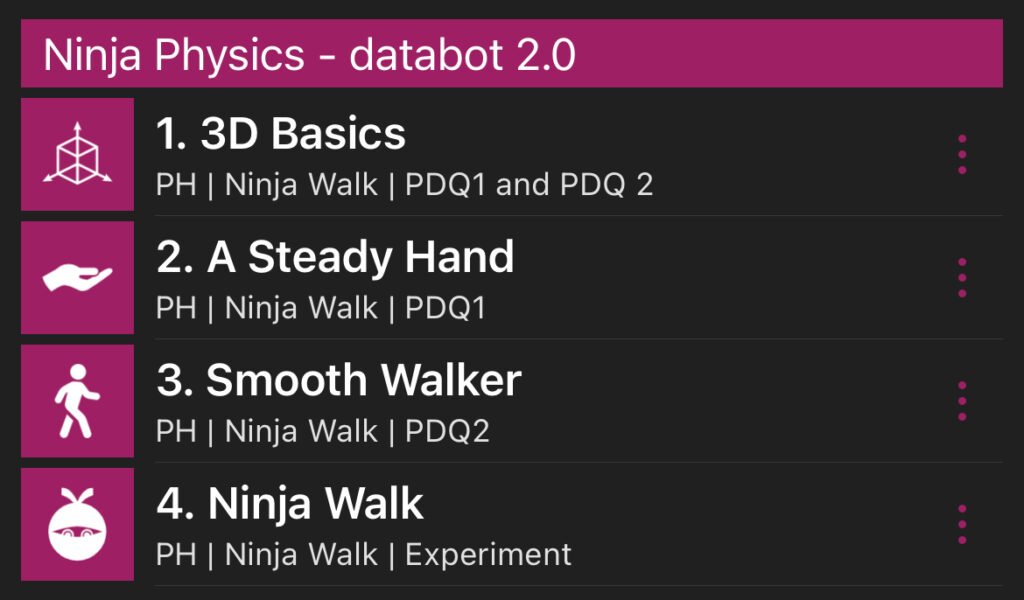
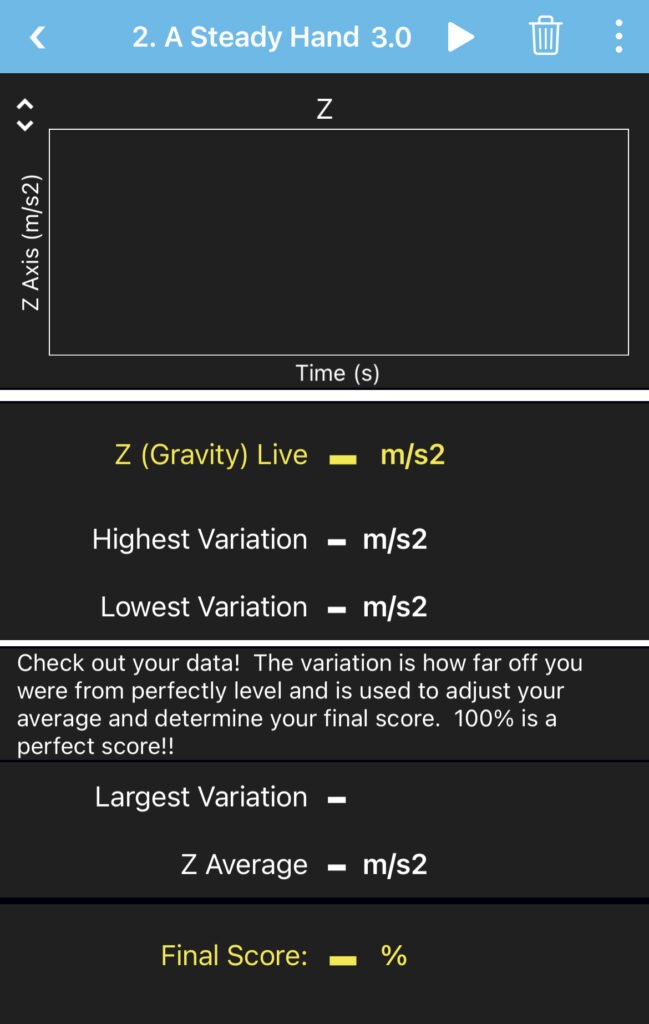
Ninja Physics

Earth Science
Clear Water

Weather Prediction

Life Science
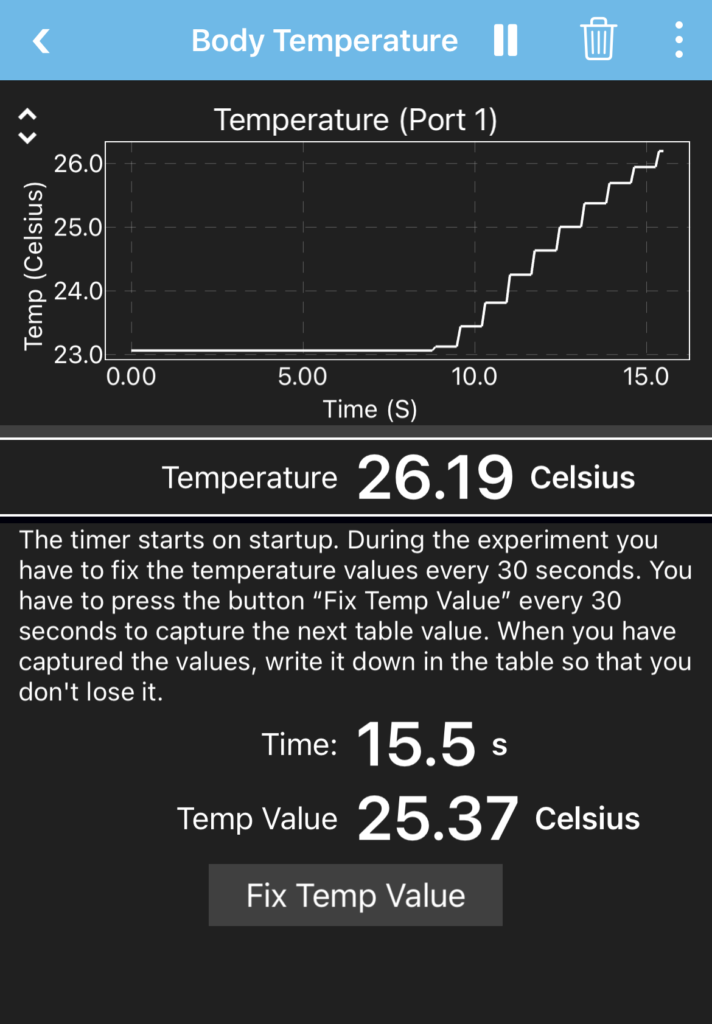
Body Temperature

Reflect and Grow


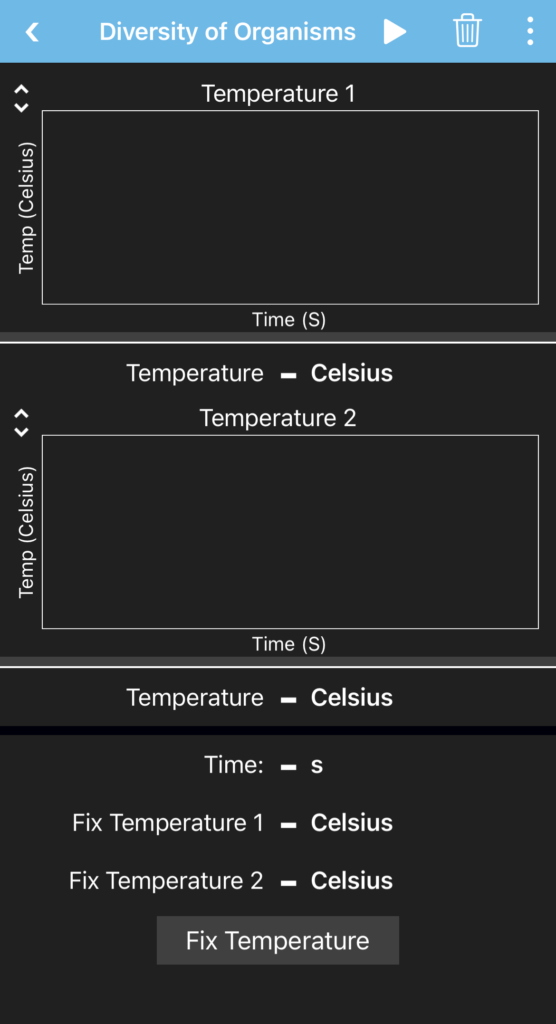
Diversity of Organisms

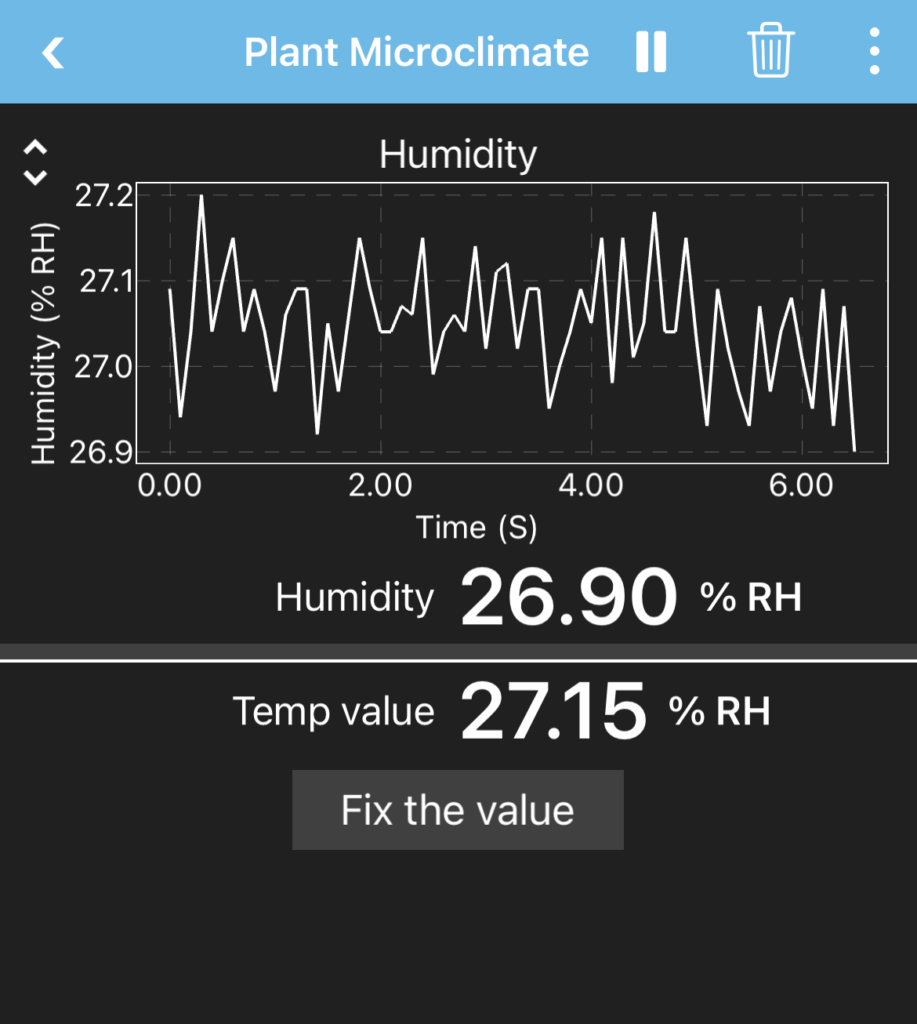
Plant Microclimate

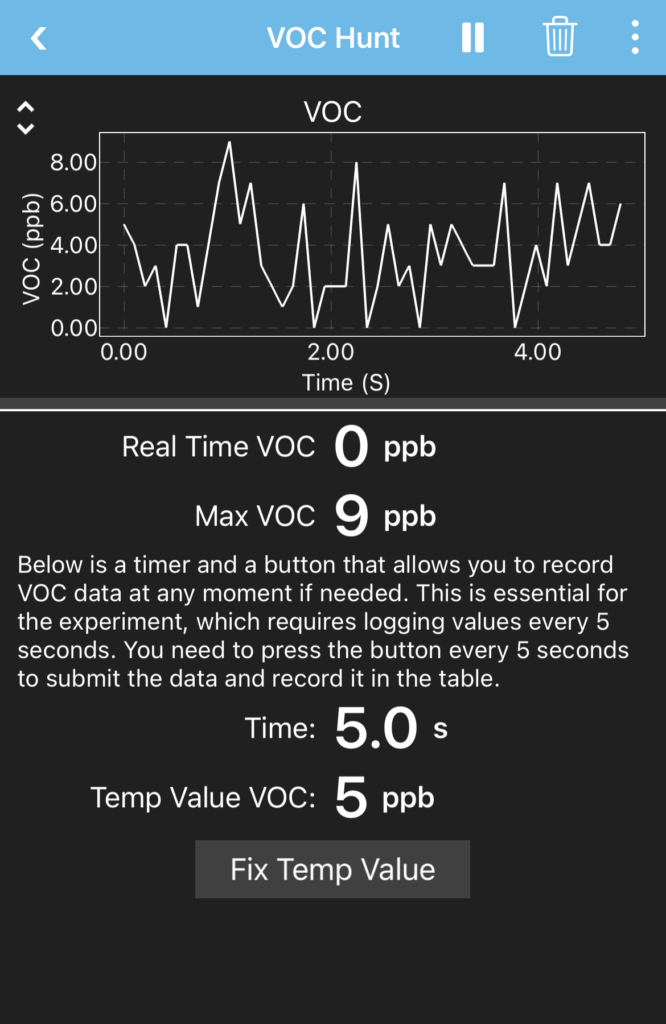
VOC Hunt

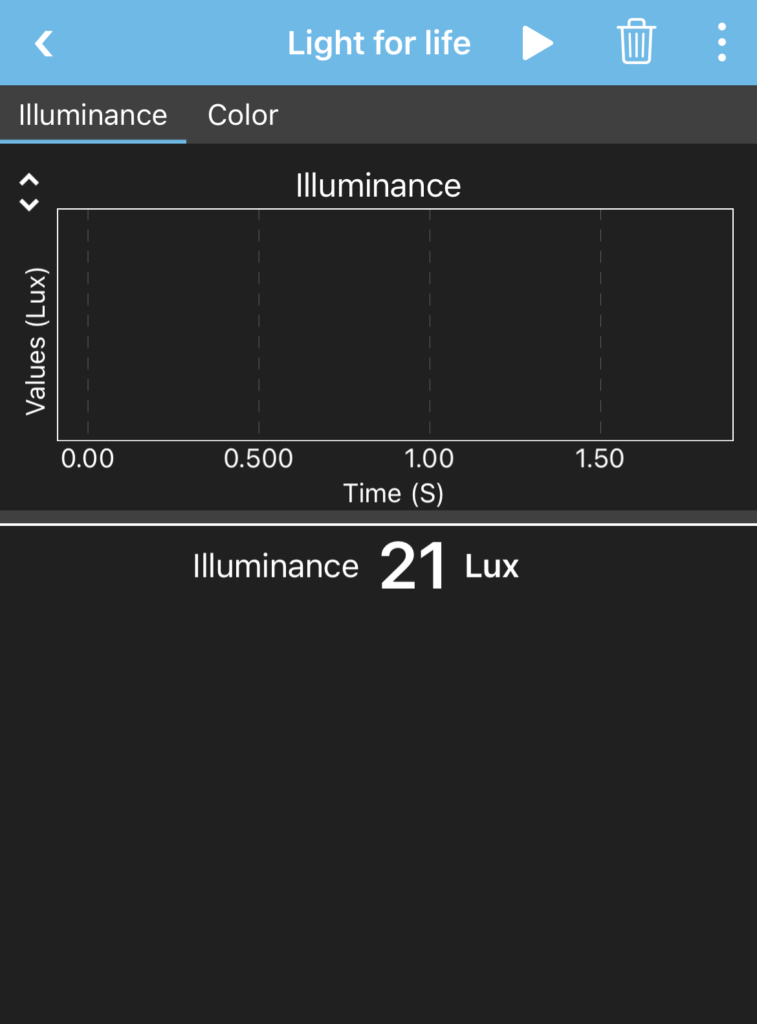
Light for life

Adaptation

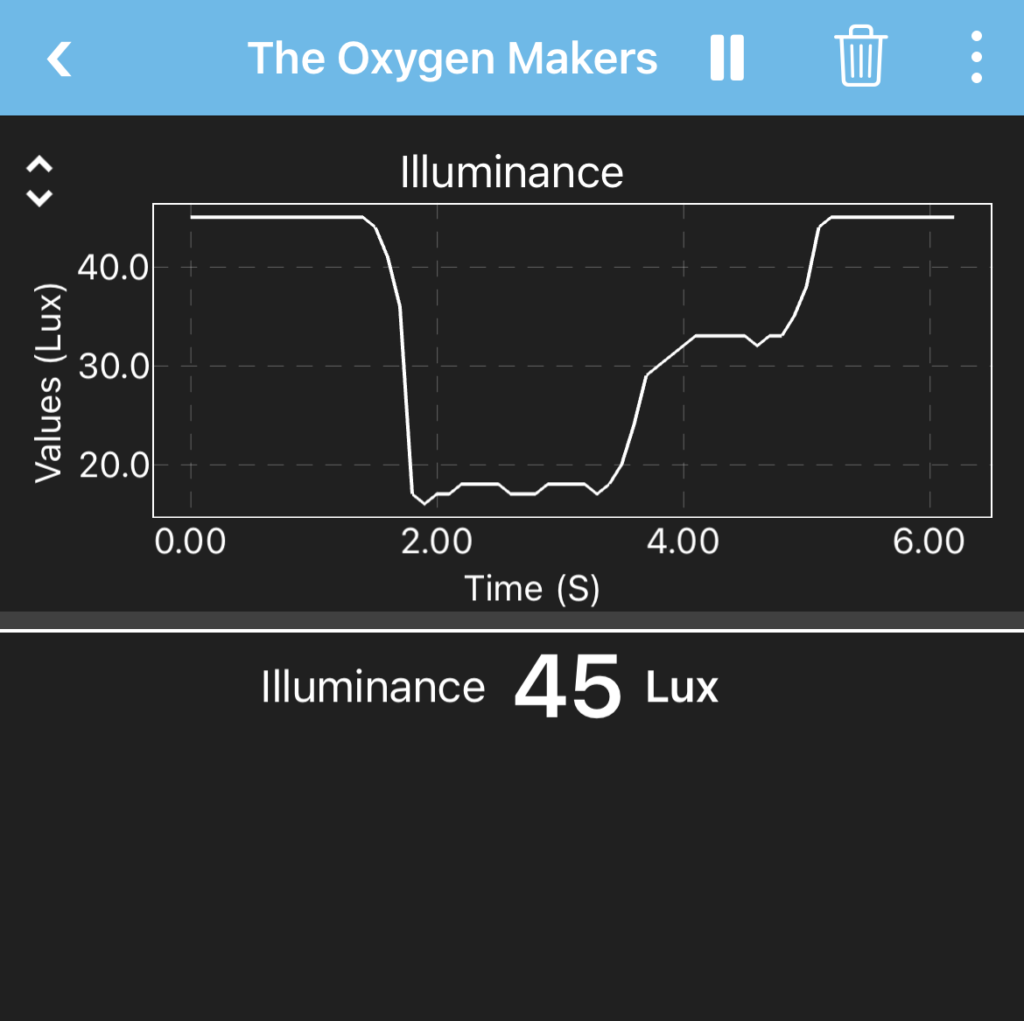
The Oxygen Makers

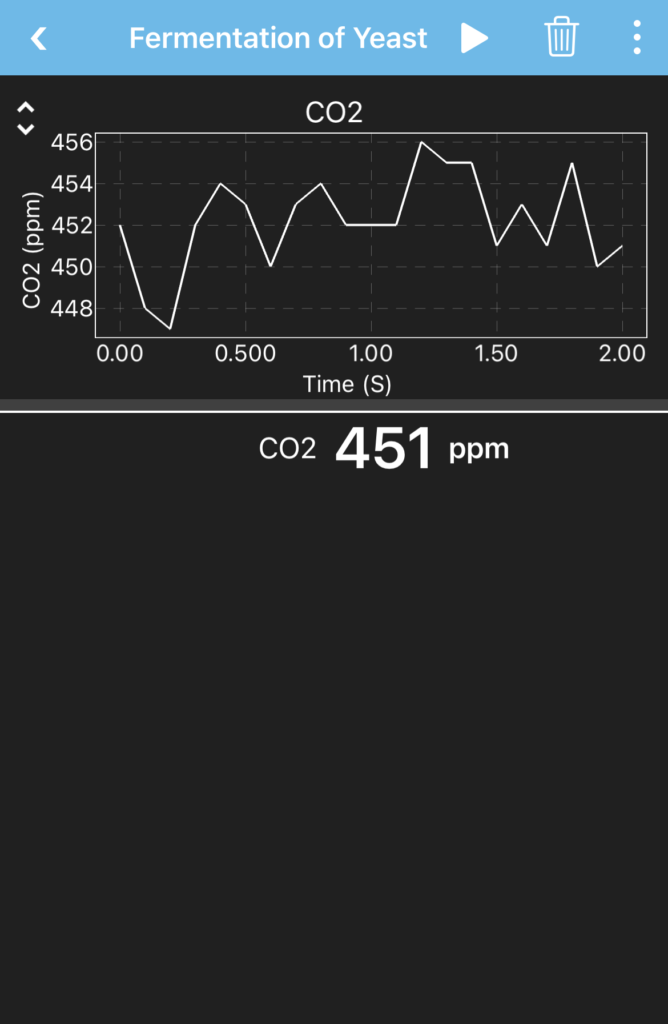
Fermentation of Yeast

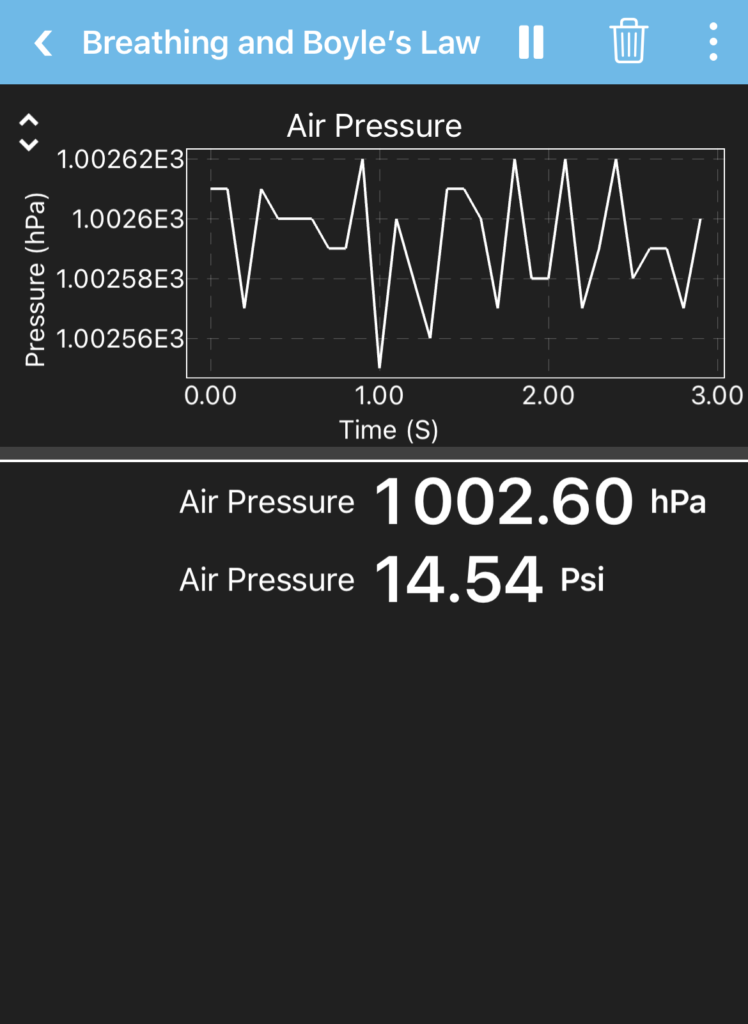
Breathing and Boyle’s Law

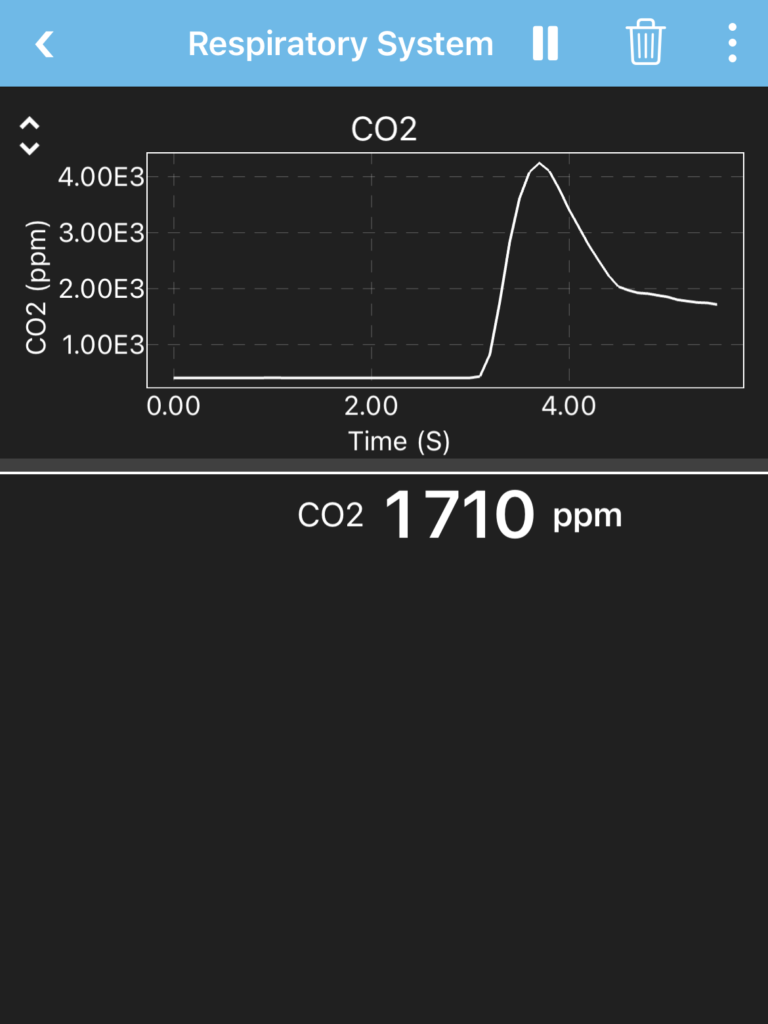
Exploring the Human Respiratory System

Physical Science
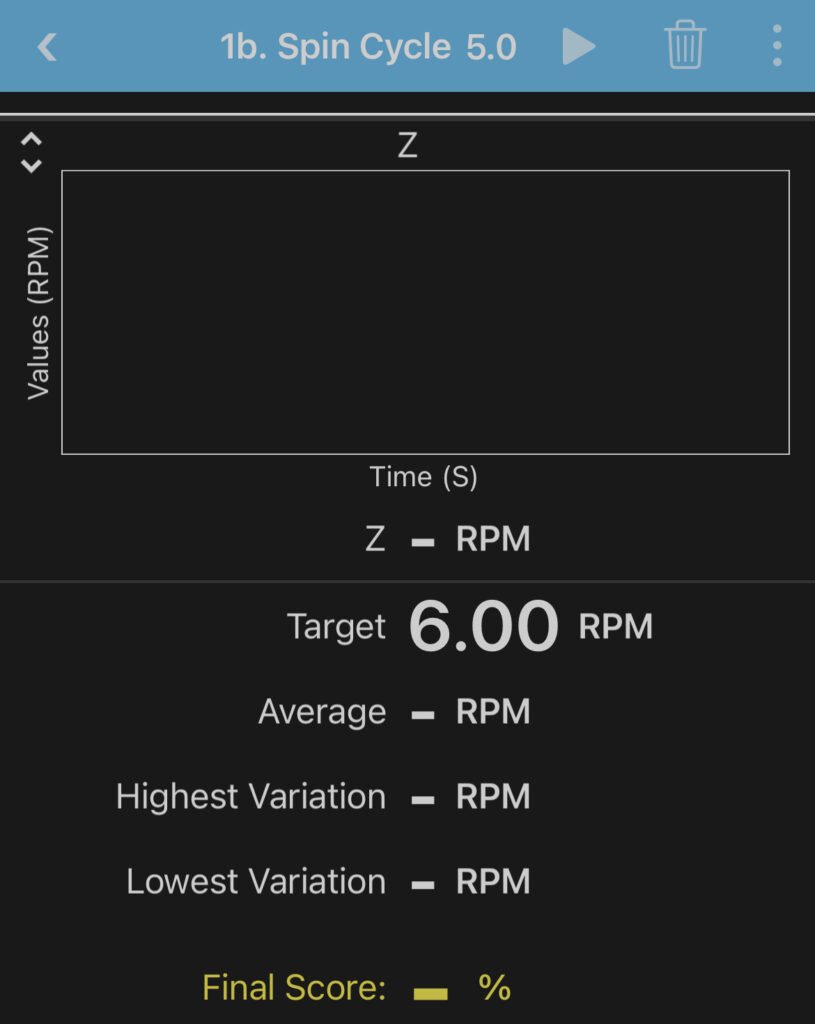
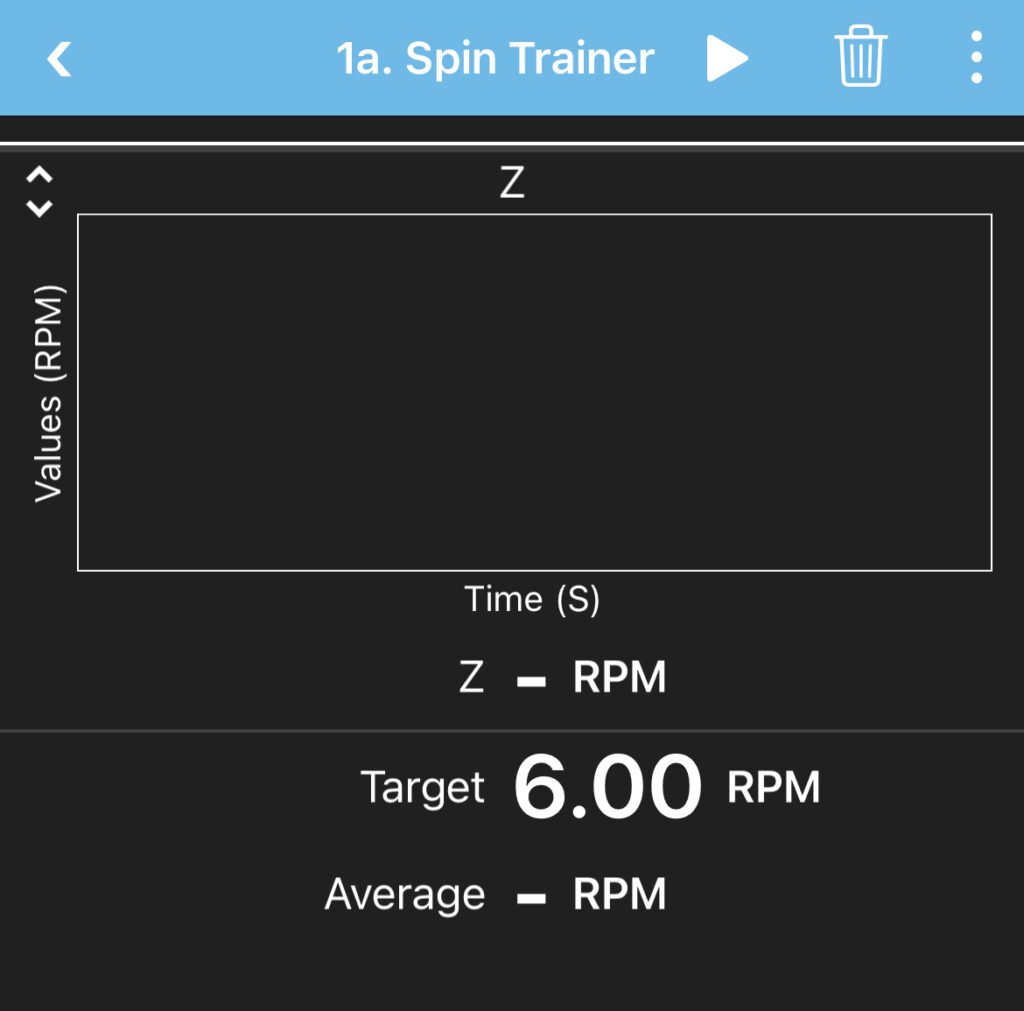
Mission Spin Cycle


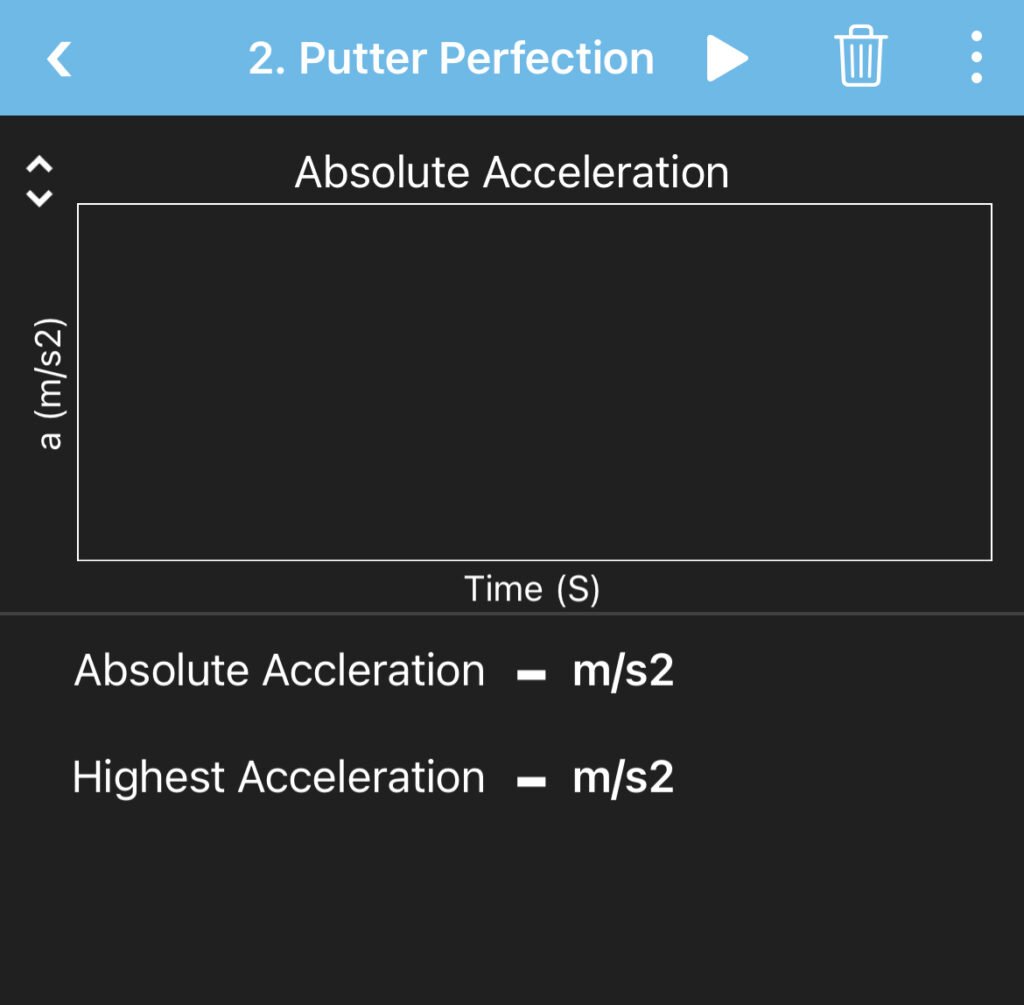
Mission Putter Perfection

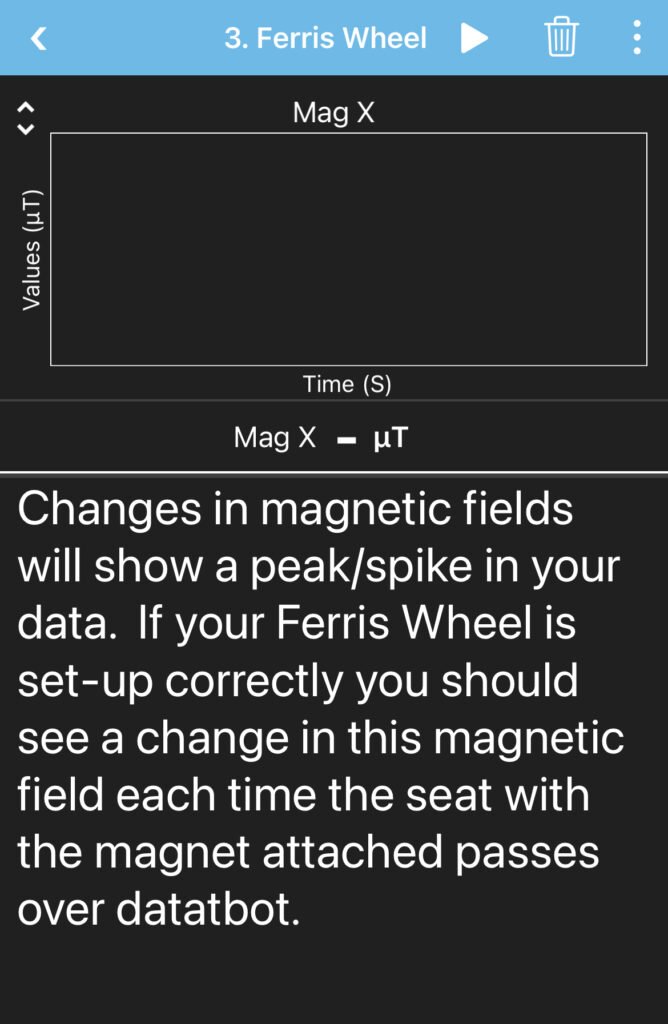
Mission Ferris Wheel

Mission The G-Force Machine

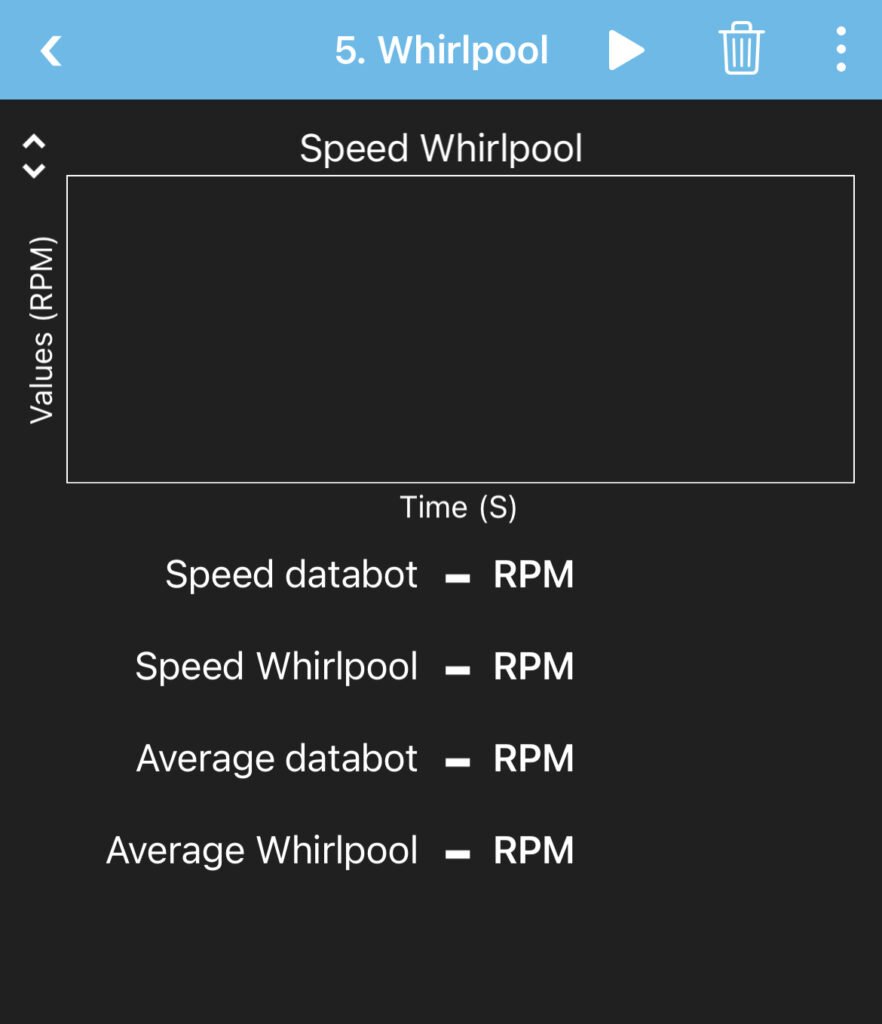
Mission Whirlpool

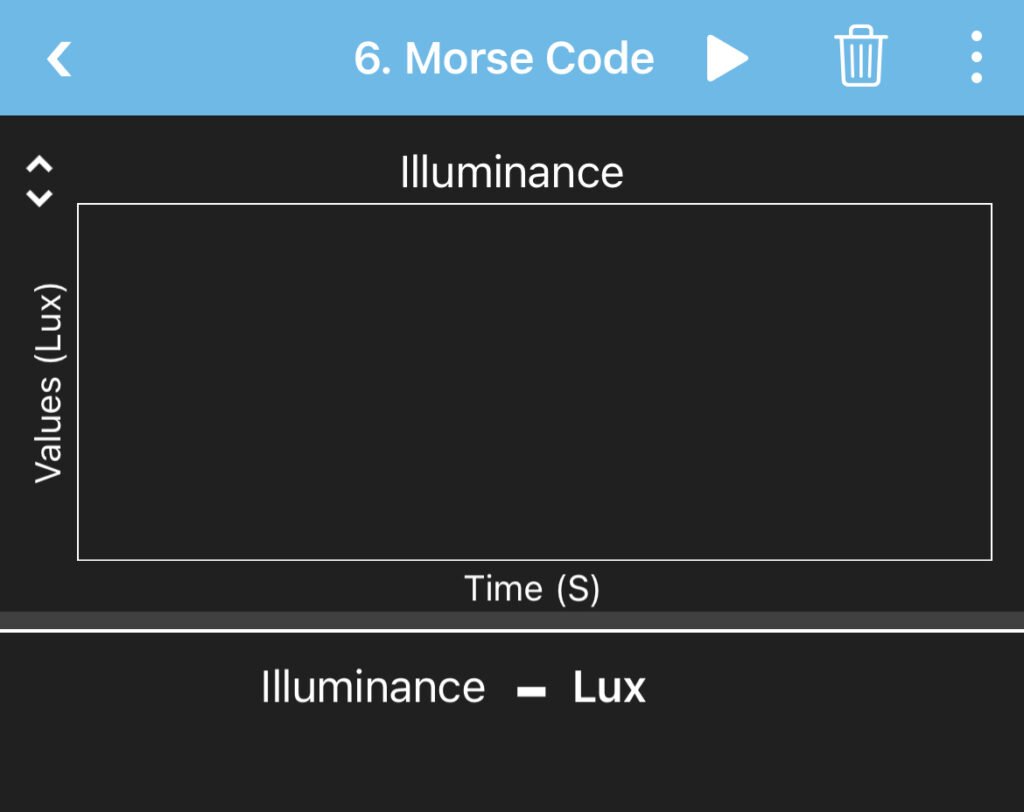
Mission Morse Code

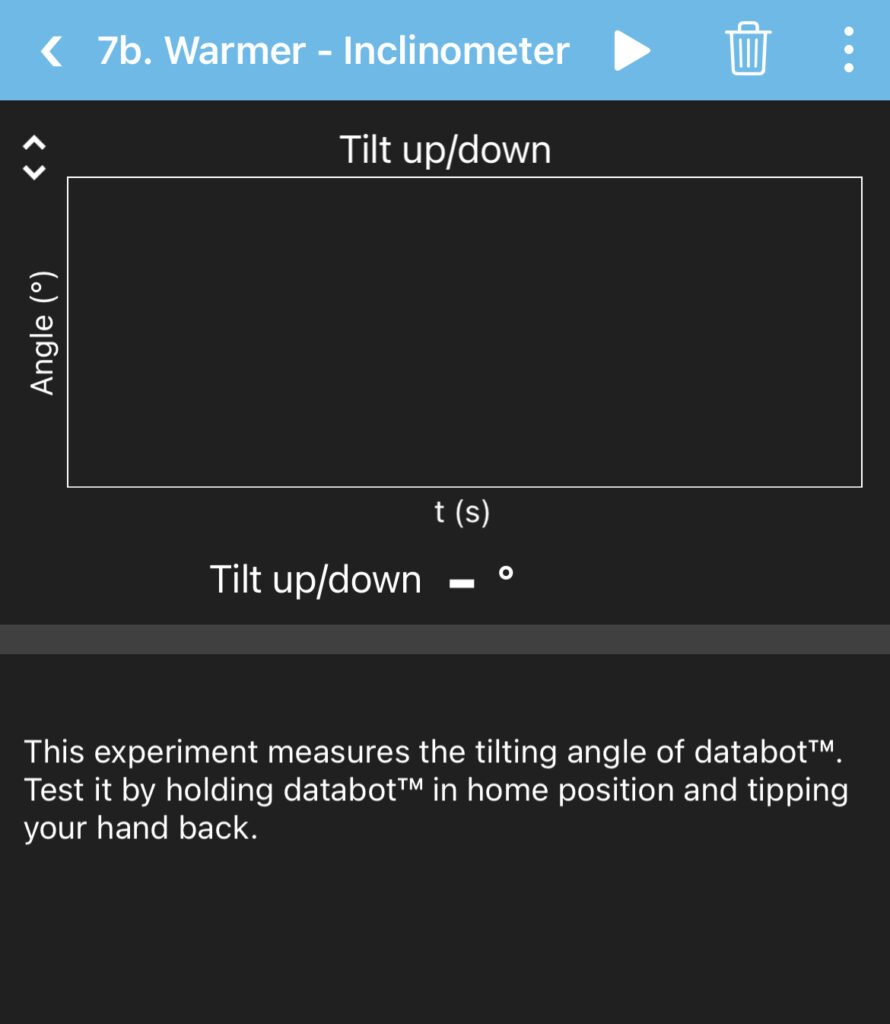
You're Getting Warmer!