Cool bananas – the more your explore the more you know about CO2!
It’s now time for some community and group hugs. Next and final stop – a collaboration activity. Enjoy!
Challenge |
Looking for too much of a good thing!
Grades:
Time:
Subject:
5-8
30 minutes or longer
Environmental Science
Join databot™ in the hunt for areas with unusually high CO2 levels.
As global CO2 levels rise, as shown by the Keeling Curve, so too does our average temperature. One impact of rising temperatures is on our massive ice sheets in Greenland and Antarctica. We see the effect of rising temperatures in melting ice and rising sea levels. Our sea level rises about an 1/8 of an inch per year.
What if all the ice in Antarctica, mountain glaciers, and Greenland melted? The answer – our oceans would rise approximately 230 feet covering all of our coastal cities and reducing our landmass considerably. Yikes!
Long term effects of global warming include drought, extreme weather patterns, more acidic oceans, impacts to agriculture, air quality, the health of our forests and more. What can we do? It begins with awareness. Study the data, understand the science, and actively participate in the hunt for solutions that can save our planet as we know it! Let’s explore further with databot™!

By completing this experiment and conducting the scientific observations associated with it you will master the following knowledge! Good luck science explorer!
In PDQ1 you explored your outdoor environment and recorded CO2 levels. Based on what you discovered, you are now challenged to seek out areas of unusually high CO2 concentrations.
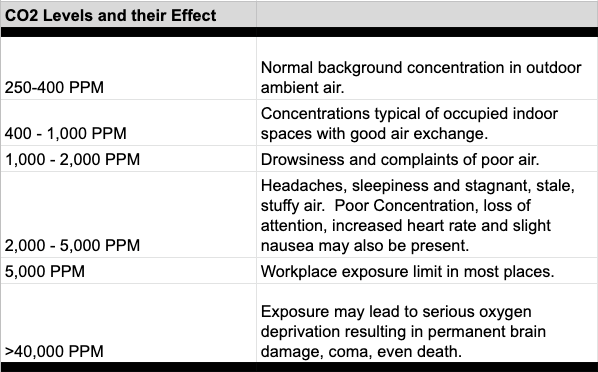
Look at the table to the right that outlines the effects of too much CO2 in the air. When you get above 1,000 PPM people begin to feel the effects of poor air. Your challenge is to go forth and explore and identify any possible areas that are above 1,000 PPM. Hopefully you do not find any – that would be good news!
If you find any locations with unusually high levels, record the time and location. Good science requires multiple tests, so return to these areas at different times and create a log of your findings. If these high levels continue, contact your local authorities and ask them who to talk with about air quality concerns. Report your findings and learn from your interactions. Being an active, concerned citizen is incredibly important so don’t be afraid to ask questions! Good luck science explorer!

It’s now time for some community and group hugs. Next and final stop – a collaboration activity. Enjoy!
These challenge extensions are designed to be fun and “challenging” for students to take them further into the topics presented in this module. There is no alternative for experiencing abstract data in real life! If you have the opportunity, please share stories about your student experiences! Use our contact form – we look forward to seeing some ingenious solutions.
Educator Info
Climate Change Image by Tumisu from Pixabay
Melting Ice Photo by Stephane YAICH on Unsplash
 You’re Getting Warmer! by Robert O. Grover & Team databot™ is licensed under a Creative Commons Attribution 4.0 International License. Permissions beyond the scope of this license may be available at databot.us.com/contact.