Data Mysteries Debut!

Data powers the world today and is the basis for all the technology that surrounds us whether it is the algorithm that delivers the appropriate advertising to us in our social stream, the right turn our autonomous car takes on its own, the GPS data that helps us navigate the world, or the automatic sprinklers, nightlights, and other smart technology that may be wired in to your home. In order to prepare students for this data powered world and the data powered career options they will face basic data literacy is a must.
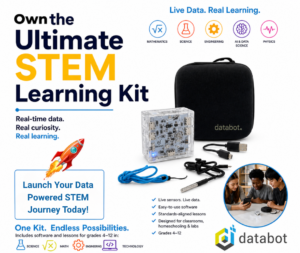
Enter databot™ – a unique, highly versatile multi-sensor tool that is all about the data. databot makes it easy to collect, visualize, and analyze data. The touch of an icon on your smart app and you are streaming data from any of the 15 on-board sensors to explore physics, chemistry, earth science, or life science topics.
In constant search of ways to make data more interesting and engaging we recently developed a model for proposing “data mysteries” in which students are presented with no information other than a data set and are challenged to explain what is going on based purely on the data.
The image shown here is our first example in which a 10 minute data set is presented showing the temperature readings of two probes that are varying from high to low at regular 30 second intervals. Upon close inspection you will note that the highs are getting consistently lower and the lows are getting consistently higher.
With nothing more than this information, what do you think is going on here? Are there multiple scenarios that could explain this behavior?!
We posed this question on LinkedIn to gather some early feedback on the approach and the response from one science educator was truly awesome.
A Scientific Approach to a Mystery
David Smith is a scientist and veteran STEM education expert with a PhD in Geology. His years as a practicing scientist combined with extensive STEM project oversight and curriculum development has well prepared him for mysteries such as the one presented here. When we posted it on LinkedIn this was his analysis, a great example of how we hope to see students approaching this type of activity.
Great activity! It looked to me, at first, like two objects with decent thermal conductivity, one at roughly 0C (ice bath?) and one at roughly 65-70C are being brought into contact and then removed from contact repeatedly. But that cannot be the case because the hot one gets very close to zero as the cold one goes up to nearly 60. Contact should produce the same temp in both materials. The two systems are slowly moving toward equilibrium as the lows in T1 get higher and the highs in T2 get lower with each cycle. So my second explanation is that the probes are being swapped between two beakers of water, one that started near 70 and one that started just above 0. The amount of water is small, so that is shows an overall warming or cooling in a relatively short time.

David Smith, PhD and Data Sleuth
More Details

Providing the students with details to make the exploration richer is easily done using Vizeey. The Vizeey app has a variety of built-in tools for quick analysis and exploration of data sets. Zoom, pan, and pick data points to explore your dataset on your smart device. Tools like linear fit enable quick and easy explorations for identifying patterns and trends. The ability to screen capture and share details like those shown above is built in and images are easily transferred by any active sharing options including text, Google Drive, Air Drop, email, etc. Create your own mysteries easily with these tools and challenge your students!
Deeper Analysis with Spreadsheets!

Vizeey also easily enables the export of any collected data set with the tap of a few menu items. Shown here is the same data set shown in Vizeey exported in Excel format and opened in Google Sheets for exploration. Download the Excel File here to explore further.

The Mystery is Revealed

Dr. Smith’s prediction was right on!
Here is the experiment setup that produced this data and a sample video below. The final experiment data provided above was conducted using two water glasses holding approximately 100ml of water each. One started with boiling water and the other with an ice bath (the ice was removed prior to beginning the experiment). Procedure:
- Leave both temperature probes laying out so they reach room temperature.
- Calibrate both temperature probes to two decimal places so they are synchronized.
- Start the dual temperature experiment in Vizeey and record room temperature for the first 30 seconds.
- At 30 seconds plunge the probes into the two glasses of water.
- Every 30 seconds thereafter swap the probes from hot to cold water.
- Stop collecting at the 10 minute mark.
The two systems are slowly moving toward equilibrium as the lows in T1 get higher and the highs in T2 get lower with each cycle. So my second explanation is that the probes are being swapped between two beakers of water, one that started near 70 and one that started just above 0. The amount of water is small, so that is shows an overall warming or cooling in a relatively short time.
ChatGPT Generates A Lesson Plan
We fed the description of this activity into ChatGPT to generate a set of instructions for educators to follow. Recognizing that educators are creative, independent thinkers, it is assumed everybody will come up with their own twist on these data mysteries. With that in mind here is a starting point for your personal exploration. Enjoy!
Lesson Plan: Unraveling the Data Mystery: Exploring Heat Transfer and Thermal Equilibrium!
Grade Level: Middle School (6th-8th grade) Duration: 2 class periods (45-60 minutes each)
Lesson Objectives:
- Students will develop critical thinking and data analysis skills by examining a provided data set and formulating hypotheses to explain the observed temperature changes.
- Students will understand the scientific principles of heat transfer and thermal equilibrium through exploration and experimentation.
- Students will conduct an experiment to investigate heat transfer and thermal equilibrium, using their hypotheses as a guide.
- Students will utilize a linear fit tool to analyze data and predict the time it takes for the system to reach equilibrium.
- Students will engage in collaborative learning and communication by working in pairs and presenting their findings to the class.
Materials:
- Two100 ml beakers
- Hot and Cold Water
- databot and two temperature probes
- Vizeey app
- Whiteboard or chart paper for class discussion
Procedure:
Day 1: Data Analysis and Hypothesis Formation
Data Mystery Introduction (Student-Facing):
- Begin the lesson by presenting students with a mysterious data set displaying temperature readings from two beakers of water over a ten-minute period.
- No prior information regarding heat transfer or thermal equilibrium will be provided at this stage. It is a pure data mystery!
- Encourage students to closely examine the data set and work in pairs to formulate hypotheses to explain the observed temperature changes.
- Instruct students to record their hypotheses and reasoning in their science notebooks.
Pair Discussion and Hypothesis Sharing:
- Allow time for students to discuss their hypotheses with their partners, considering variables that could potentially explain the temperature changes.
- Encourage students to think critically and engage in scientific reasoning, providing evidence-based explanations for their hypotheses.
- Facilitate a class discussion where pairs can share their hypotheses, fostering a collaborative environment where ideas are exchanged.
Introduction to Scientific Principles:
- After collecting students’ hypotheses, introduce the scientific principles of heat transfer and thermal equilibrium.
- Discuss concepts such as conduction and the movement of thermal energy from higher temperature objects to lower temperature objects until equilibrium is reached.
- Relate these principles to the data mystery, explaining how the hypotheses proposed by students align with these scientific concepts.
Day 2: Experiment, Data Analysis, and Conclusion
Experimental Setup:
- Divide students into pairs and distribute the materials (beakers, water, temperature probes, databot and Vizeey).
- Instruct students to set up the experiment by filling one beaker with near-freezing water and the other with near-boiling water.
- Calibrate the temperature probes to the room temperature and ensure they are logging data synchronized to two decimal places.
Conducting the Experiment:
- Direct students to plunge the temperature probes into the individual beakers and swap them back and forth every 30 seconds.
- Instruct students to record temperature readings at regular intervals, e.g., every 30 seconds, for a period of ten minutes.
- Encourage students to handle the beakers carefully to minimize external factors affecting the temperature changes.
Data Analysis and Prediction:
- After conducting the experiment, guide students in using the linear fit tool in their data logging software/apps to analyze the collected data.
- Assist students in interpreting the linear equation (y = ax + b) obtained from the linear fit and its relationship to the temperature changes observed.
- Instruct students to use the linear equation to predict when the two beakers will reach equilibrium, based on their data and analysis.
- Encourage students to compare their predictions with the actual time it takes
Educational Standards
The activity described in the lesson plan satisfies a number of educational standards as Heat Transfer and Thermal Equilibrium are important core science concepts and the scientific practices of collecting and analyzing data are also a core requirement of most standards bodies.
NGSS
Here are several relevant NGSS standards and practices:
NGSS Standards:
- MS-PS1-4: Develop a model that predicts and describes changes in particle motion, temperature, and state of a pure substance when thermal energy is added or removed.
- MS-ETS1-4: Develop a model to generate data for iterative testing and modification of a proposed object, tool, or process such that an optimal design can be achieved.
Science and Engineering Practices:
- Asking Questions and Defining Problems: Students propose explanations for the observed data and question the causes of temperature changes.
- Developing and Using Models: Students develop a model to predict and describe the behavior of the system.
- Planning and Carrying Out Investigations: Students conduct an experiment, collect data, and analyze it to understand heat transfer and thermal equilibrium.
- Analyzing and Interpreting Data: Students analyze the collected data using a linear fit tool to make predictions and draw conclusions.
- Engaging in Argument from Evidence: Students engage in class discussions, present their predictions and findings, and compare their explanations to reach consensus.
- Obtaining, Evaluating, and Communicating Information: Students use data logging software/apps to gather and analyze data, and communicate their predictions and findings to peers.
These standards and practices promote the development of scientific inquiry, critical thinking, data analysis, and communication skills among students while exploring the principles of heat transfer and thermal equilibrium.
About databot™
databot™ learning solutions transform the way K12 students experience data, science, and technology. In the classroom, after-school, and in the home, our mission is to make interacting with and understanding data a beautiful, fun, and ubiquitous experience. One that crosses the traditional boundaries of all learning environments. The world is driven by data and we are driven to teach future generations how to use it for good. We create data powered technology and brilliant learning activities that empower students everywhere to think deeply, explore with passion, and solve our planetary scale challenges.
Contact us to share ideas, comments, and learn more about our products and mission.