Data Mystery #2
In our ongoing quest to make data more interesting and exciting, we recently developed a model for offering “data puzzles” where students are given only a set of data and must explain what is happening based on that data alone.
Stop, don’t scroll down the page. Test your skills and knowledge of science. Look at the picture below.
The challenge for today has to do with three sensors: a CO2 sensor, a temperature sensor, and a humidity sensor. The databot is in a specific environment and is exposed to specific external factors. Your task is to determine what environment the databot is in and what factors are affecting it.
Our post on Linkedin

“Information is the oxygen of the modern world.”
This statement is attributed to Ronald Reagan. It underscores the significance of information and knowledge in today’s world, where access to information and the ability to harness it play a pivotal role in achieving success and influence.
Timely detection of data and readings holds immense importance in our lives. For instance, swiftly identifying a gas leak in an apartment not only aids in preventing fires but also saves human lives.
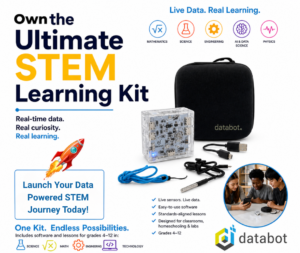
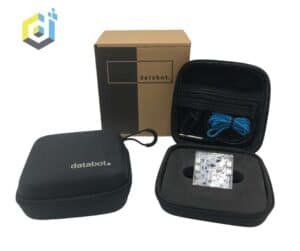
databot is an astonishing device equipped with 15 built-in sensors. Its ability to retrieve readings from all sensors collectively or from each sensor individually sets it apart. However, one of its standout features that distinguishes it from competitors is the inclusion of an integrated battery. This empowers the utilization of databot anytime, even in remote areas far from civilization and computers. You simply need to retrieve it, press the power button, and connect to databot using your phone. This process takes merely a few seconds.
Today’s mystery revolves around three sensors: the CO2 sensor, the temperature sensor, and the humidity sensor. What do you think is captured with databot?
A Scientific Approach to a Mystery
Sharing our second puzzle on LinkedIn sparked the curiosity of our community, and we’re excited to share the results!


Thank you to everyone who engaged in deciphering the puzzle. Your insights and contributions exemplify the strength of a vibrant community united by a passion for learning and exploration. Stay tuned as we unravel more mysteries and continue this journey of discovery together!
More Details


To quickly retrieve data directly from databot, we use the Vizeey app. It can display information and draw graphs in real time. This greatly simplifies working with the many sensors present in databot and gives insight into visualizing the data.
In our experiment we drew 3 graphs at once. By comparing time and values we can analyze the information and try to solve our riddle.
Deeper Analysis with Spreadsheets!

Vizeey also easily enables the export of any collected data set with the tap of a few menu items. Shown here is the same data set shown in Vizeey exported in Excel format and opened in Google Sheets for exploration.

Check it out in CODAP!
We recently started exploring Concord Consortium’s remarkable site filled with free resources for exploring data. Below is our mystery recreated in CODAP, Common Online Data Analysis Platform!
The Mystery is Revealed


Here is the experiment setup that produced this data. The final experiment data presented above were obtained through the “Candle in a Jar” experiment. databot with a lighted candle was placed in a closed jar and the air readings in the enclosed space were studied. Procedure:
- Connect the temperature sample to the databot and secure it so that it can be placed in the jar with the candle.
- Light the candle and start the experiment in Vizeey. Record the temperature, humidity, and CO2 readings in the open jar for 60 seconds.
- Cover the jar with the candle with the jar lid.
- Collect air readings in the jar for 120 seconds.
- Stop the experiment.
The temperature increase is a result of the heat energy released during the combustion process of the candle.
The rise in CO2 levels is attributed to the candle consuming oxygen and producing carbon dioxide.
The humidity increase is due to the water vapor released by the burning candle, along with the heat contributing to evaporation.
These changes in data provide insights into the dynamic nature of environmental factors within a closed system. The experiment demonstrates how seemingly unrelated changes in temperature, CO2 levels, and humidity are interconnected through the processes occurring during the burning of the candle.
ChatGPT Generates A Lesson Plan
We fed the description of this activity into ChatGPT to generate a set of instructions for educators to follow. Recognizing that educators are creative, independent thinkers, it is assumed everybody will come up with their own twist on these data mysteries. With that in mind here is a starting point for your personal exploration. Enjoy!
Lesson Plan: Unraveling the Data Mystery: Candle in a Jar
Grade Level: Middle School (6th-8th grade) Duration: 2 class periods (45-60 minutes each)
Lesson Objectives:
1. Students will develop skills in analyzing graphical data and identifying patterns.
2. Students will apply critical thinking to formulate and defend hypotheses based on data analysis.
3. Students will gain hands-on experience in designing and conducting controlled experiments.
4. Students will learn to use sensor technology for data collection and analysis.
5. Students will understand the relationship between temperature, CO2 level and humidity and observe the effects of combustion on the environment.
6. Students will enhance scientific communication and collaboration through discussions and hypothesis sharing.
Materials:
Glass jar with lid
Candle
Matches or lighter
Databot™ with temperature probe
Vizeey app
Whiteboard or chart paper for class discussion
Procedure:
Day 1: Data Analysis and Hypothesis Formation
- Data Mystery Introduction:
- Begin the lesson by presenting students with a mysterious data set displaying data readings obtained in the 2-minute candle burning experiment
- In groups or individually, students analyze the graphs, noting the patterns of change in each factor over time.
- Discuss the following questions as a class:
What environmental factors do the graphs represent?
How do the graphs change over time? Do they increase, decrease, or fluctuate?
What might be causing these changes?
Can you identify any relationships or patterns between the three factors?
- Hypothesis Formulation:
- Based on their graph analysis, students individually formulate hypotheses about the experiment that could lead to the observed changes. Encourage creative thinking.
- Students share their hypotheses with the class, explaining their reasoning behind their ideas.
- Introduction to Scientific Principles: – After collecting students’ hypotheses, introduce the scientific principles of combustion. – Discuss connections between combustion and environmental changes.
Day 2: Experiment, Data Analysis, and Conclusion
- Experimental Setup:
- Recap the hypotheses formulated in the previous lesson
- Introduce the experiment: Candle in a jar using the databot to collect data.
- Safety Considerations:
– Prioritize safety by conducting the experiment in a well-ventilated area.
– Supervise the lighting of the candle and ensure safe handling of matches or a lighter.
– Handle the glass jar with care, as it may become hot during the experiment.
- Conducting the Experiment
- Students work in pairs or small groups to set up the experiment:
- Attach databot with temperature prob inside the jar securely.
- Place the lit candle inside the jar.
- Connect databot to the mobile devices using the Vizeey app.
- Start data collection on the app and monitor the temperature, CO2 and humidity readings for a minute.
- Cover the jar with a lid and observe the changes in readings for 2 minutes.
- Data Analysis and Conclusion
- Discuss the collected data as a class, analyzing the temperature and CO2 level graphs.
- Compare the data collected from the experiment to the initial hypotheses and the patterns observed in the graph analysis
- Encourage students to draw conclusions about the experiment’s results:
– Were the hypotheses confirmed by the data?
– What do the temperature and CO2 level graphs reveal about the experiment’s outcomes?
– How do these results align with the initial graph analysis?
– What connections can be made between the temperature, CO2 levels, and humidity in this experiment?
NGSS Standards
- MS-PS1-2: Analyze and interpret data on the properties of substances before and after the substances interact to determine if a chemical reaction has occurred.
- Relevance: Students analyze data related to changes in CO2, temperature, and humidity to determine if a chemical reaction (combustion) has taken place.
- MS-PS1-5: Develop and use a model to describe how the total number of atoms does not change in a chemical reaction and thus mass is conserved.
- Relevance: The burning candle offers an opportunity to discuss conservation of mass in chemical reactions, as the CO2 measurements can serve as evidence.
- MS-ETS1-3: Analyze data from tests to determine similarities and differences among several design solutions to identify the best characteristics of each that can be combined into a new solution to better meet the criteria for success.
- Relevance: Students use databot to collect and analyze data, which can be applied to different solutions for achieving complete combustion or minimizing waste
HS-PS1-4: Develop a model to illustrate that the release or absorption of energy from a chemical reaction system depends upon the changes in total bond energy.
- Relevance: The combustion of the candle can serve as an example to discuss energy release in chemical reactions.
HS-PS1-5: Apply scientific principles and evidence to provide an explanation about the effects of changing the temperature or concentration of the reacting particles on the rate at which a reaction occurs.
- Relevance: Changes in temperature and CO2 concentration can be analyzed to understand the rate of the chemical reaction.
HS-ETS1-4: Use a computer simulation to model the impact of proposed solutions to a complex real-world problem with numerous criteria and constraints on interactions within and between systems relevant to the problem.
- Relevance: Databot serves as a tool for data collection and analysis, facilitating a deeper understanding of complex systems like chemical reactions.
These standards provide a solid framework for educators to align your described activity with NGSS guidelines. The use of databot allows for real-world application of these science concepts, thereby enhancing the learning experience.
These standards and practices promote the development of scientific inquiry, critical thinking, data analysis, and communication skills among students while exploring the principles of chemical reactions..
About databot™
databot™ learning solutions transform the way K12 students experience data, science, and technology. In the classroom, after-school, and in the home, our mission is to make interacting with and understanding data a beautiful, fun, and ubiquitous experience. One that crosses the traditional boundaries of all learning environments. The world is driven by data and we are driven to teach future generations how to use it for good. We create data powered technology and brilliant learning activities that empower students everywhere to think deeply, explore with passion, and solve our planetary scale challenges.
Contact us to share ideas, comments, and learn more about our products and mission.