In this comprehensive guide, we’ll walk you through everything you need to know about using Excel Data Streamer with Databot, from the basics of getting started to advanced techniques and educational applications.
Introduction
When it comes to data analysis, Excel has been a reliable companion for students and professionals alike. However, with the advent of real-time data streaming, a new dimension has been added to the way we interact with and interpret data.
This guide aims to provide you with a hands-on approach to using Excel Data Streamer in conjunction with Databot, a dynamic tool that amplifies the capabilities of Excel. By the end of this guide, you’ll be equipped with the skills to harness the power of real-time data for various projects and learning opportunities.
What is Excel Data Streamer
At its core, Excel Data Streamer is a feature that allows you to visualize and analyze data in real-time. Whether you’re collecting data from scientific experiments, conducting surveys, or tracking financial trends, Excel Data Streamer lets you see changes and insights as they happen, enabling you to make informed decisions quickly.
How does it work
Excel Data Streamer works by establishing a connection between your Excel spreadsheet and a data source, such as databot. This connection enables live data streaming, meaning that any changes or updates to the data source are immediately reflected in your Excel worksheet.
This dynamic link empowers you to create interactive visualizations and perform on-the-fly analysis without the need for manual data entry or constant refreshing.
Getting Started
Before you dive into the world of real-time data streaming, it’s important to ensure your system meets the necessary requirements and that you have the required software installed.
System Requirements:
Operating System: Windows 10 or above.
Microsoft Excel for Microsoft Office 365 (version 16.0.11629.20236) and later versions.
databot with MicroUSB cable and the Vizeey app
1. Enabling Excel Data Streamer
Getting started with Excel Data Streamer is a straightforward process. Follow these steps to enable Excel Data Streamer. Before that First step is to Sign in to an Office 365 account.
1. Launch Microsoft Excel on your computer.
2. Open New Workbook in Excel. You will see no Ribbon as Data Streamer in the section.
3. Now to add a Data streamer click on →File menu. At the bottom you will see Options click on it.
4. Now Click on Add-ins and the drop-down menu will appear near Manage you will see “COM Add-ins” and click ‘Go..’ as the image shown below.
5. COM Add-ins tab will appear, Now select “Microsoft Data Streamer for Excel” and click Ok.
Click on any Insert menu and select My Add-ins and tap on Manage other add-ins.
You’ll notice various options on the ribbon, and one of them is Data Streamer, which might not be selected. To enable it, simply click on it to mark it with a checkmark, and then press the “OK” button.
Congratulations! You’ve successfully enabled Excel Data Streamer. In the next section, we’ll explore how to connect Databot to Excel Data Streamer to unlock its full potential.
2. Connecting Databot
Meet databot
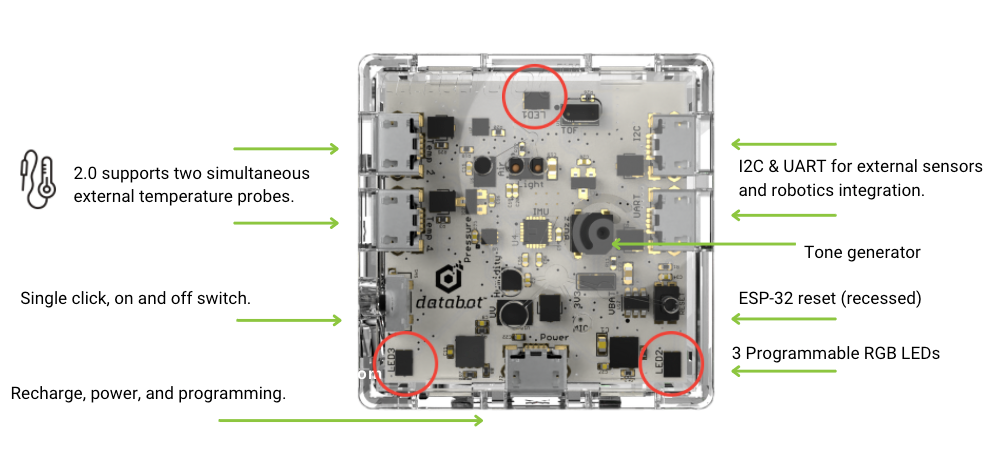
Databot™ is a low-cost, friendly, and engaging all-in-one sensor device that combines 15 internal sensors, 1 external temperature probe (supports two simultaneous probes), Bluetooth low energy wireless, and Wi-Fi to provide a remarkably versatile educational tool for students from grades 4 and up.
Temperature Sensor
Humidity Sensor
Motion Sensor
Light Sensor
Sound Sensor
& much more!
Now to connect to databot you need the following things:
databot™ (Don’t have databot yet? Enhance your data analysis journey by unlocking the full potential of Excel Data Streamer with databot – Get yours here!)
Install COM Port driversfor databot (If databot does not connect).
On a Smartphone or tablet Download the “Vizeey” app and follow these steps Startup guide to connect.
Connect databot to PC through a USB data cable.
Connecting databot and Data Streamer
Now Open Excel and click on the Data Streamer option.
Ensure that you have successfully connected databot to your PC and confirmed the activation of the Red and Blue indicator lights.
1. Click the “Connect Device” button, where you’ll find an option resembling the “USB COM port.“
Select this USB option to establish the connection.
2. The new sheet will appear as the image seen below↵
3. Now Open Vizeey connect Bluetooth as per the guide and run “Master Display”.
Tap on the > play icon and data will begin to display.
NOTE: Make sure databot is connected with PC while you run the experiment on Vizeey.
4. At the same time, data will start showing up on the Excel Data Streamer dashboard.
Now that Excel Data Streamer is up and running seamlessly you can see live sensor data streaming in from databot’s multiple sensors. You can be very selective with the various Vizeey experiments – for example use the experiment for CO2 in Vizeey and you will only stream the CO2 value and time stamp. Ready to experiment?! Go!
Check Out a Pre-Built Dashboard
While the default data streamer may present data in a complex manner, we’ve got you covered with the databot Environmental Dashboard. Experience enhanced real-time data comprehension as we offer you the databot Dashboard for a more intuitive and insightful data representation.
databot Environment Dashboard
As data streams into Excel from databot, your visualizations will update automatically. This means that any changes in the data source will be reflected in your charts and graphs in real time. You can also configure the frequency of data updates based on your preferences.
The attached GIF provides a captivating glimpse into the dynamic world of data visualization. It showcases how data seamlessly transforms into informative graphs and charts, simultaneously displayed on both the Excel dashboard and the Vizeey app.
The Excel databot dashboard, equipped with interactive charts and graphs, serves as your ultimate tool for enhanced data comprehension.
Visual representations make understanding data a breeze, allowing you to grasp insights more effectively.
Moreover, the beauty of this dashboard lies in its real-time capabilities. Witness live changes not only within the Vizeey platform but also directly on the Excel databot dashboard.
This dynamic experience ensures that you’re always in the loop, capturing every nuance of data fluctuations as they happen.
How Students can Benefit from Excel Data Streamer
Students can gain several benefits from using Excel Data Streamer:
Active Learning: Interact with real-time data streams to gain a deeper understanding of concepts.
Science Experiments: Monitor and analyze data from experiments, such as tracking plant growth or temperature changes.
Environmental Studies: Collect and analyze environmental data, such as pollution levels or weather patterns.
Practical Application: Apply theoretical knowledge to real-world scenarios, making learning more meaningful.
Data Literacy: Develop essential data literacy skills by collecting, analyzing, and visualizing data.
The possibilities are vast, and Excel Data Streamer empowers students to explore and engage with various subjects in innovative ways.