Atmospheric pressure is an invisible force that surrounds us every day, pressing upon us from all sides as the force of gravity exerts its pull on the Earth’s atmosphere. But did you know that air pressure significantly influences us and our lives? Air pressure impacts weather phenomena and can even impact your health. For example, people might complain of joint pain when a storm is coming. This is because a low pressure zone is associated with stormy weather, and a drop in air pressure allows our tissues to expand and apply pressure to our joints. If you have arthritis or sensitive joints, this can be quite painful. Many other aspects of life are impacted by air pressure but we rarely think about it!
Today, we explore air pressure through a fun Data Mystery and challenge your inquisitive mind to solve this puzzle with your wits!
Solve this mystery through data analysis alone – what could cause this!?
Essence of the Air Pressure Experiment
The experiment is based on measuring changes in air pressure using databot during a specific activity.
CLUE: the phenomenon being represented is VERY COMMON. Everyone has probably witnessed or actually done this at one time or another.
CLUE: The duration and interim steps of the experiment may vary significantly, however, the experiment consistently demonstrates an initial significant air pressure spike, followed by a rapid descent to a much lower initial value. Subsequently, the pressure gradually increases in increments. When the pressure nears or exceeds the initial peak value, it sharply returns to the original level.
CLUE: The initial air pressure level and the ending air pressure value are equal.
CLUE: Ponder the different data sets. The beginning and end are very similar for each set, but the interim data seems to vary wildly. The time frame also ranges widely from 40 seconds to 100 seconds. Do you think this is an artificial (human-made) phenomenon or naturally occurring?
Deeper Analysis with Other Tools
Easy Analysis with Vizeey
Data exploration becomes remarkably easy with databot™ and the Vizeey app. With 15 sensors packed into this compact device plus external add-ons, databot enables fast, easy, and comprehensive data collection, while Vizeey’s intuitive interface simplifies the analysis process. Simply tap on a graph and you can immediately begin exploring data sets – pinch to zoom, tap to reveal. The real-time visualization features of Vizeey provide instant insights enabling users to explore patterns and trends effortlessly. Together, databot and Vizeey offer a user-friendly, seamless experience, making data-driven scientific exploration accessible to all.
Exporting To Other Applications
In addition, exporting data sets from Vizeey is accomplished easily as you select your format and method of export from your device then load it it into your program of choice! All of this is accomplished wirelessly, connecting to databot by bluetooth, then transferring the data through your regular device connections.
Click to download the Excel Spreadsheet
Ready to explore in more depth? Download this exported data file and use Sheets, Excel, Numbers, or other programs to look further into this mystery!
Saving Data Sets for Later Recall or Sharing
Vizeey also has functionality that easily enables students to save the current state of their experiment, share that data through sharing options that are enabled, and instructors can even save these data sets to share class-wide.
Here is second export in Excel format that you can download and explore as a class in any spreadsheet or other data analysis tool. Compare the data sets from export 1 and export 2 here – do you see any similarities, trends, patterns, or values that might give you a clue that will solve the mystery?
CLUE: Look at the starting and ending air pressure value for each data set. These activities took place in the same location at the same time.
Bring Along Your AI Companion to Help
One of the best uses of AI in the classroom is to use it as a tool for guided inquiry. For a Data Mystery such as this Air Pressure Enigma, it is a perfect opportunity to set up a framework for students to think critically, ask questions to dig deeper, and learn how to solve problems with data.
You essentially set up your favorite AI assistant ahead of time, train it to behave itself and not give away any answers, but to facilitate questions and answers that will help students develop their own theories about what is causing the phenomenon. We also developed a set of prompts to assist with this inquiry process that are shared in the presentation.
For the demonstration class we have developed, we use GPT, but you can use any tool, just practice ahead of time so you know it is doing what you want it to do.
Access the Air Pressure Enigma Canva presentation here!
We also try to use the voice interface when possible, 1) because it helps students learn how to carefully frame questions before speaking; and 2) it is just plain fun to talk to AI and work through this mystery together. The complete slide deck / presentation for teachers is available here with tips and techniques for setting up your AI and conducting the mystery with your class. Feel free to duplicate images and slides for your own classroom use. If you have databots, they are a fantastic tool for the grand finale when students replicate the mystery data set themselves. However, if you don’t have a sensor device, you can still conduct the mystery using the provided data sets. Make sure everyone gets to explode a balloon at the end!
The Air Pressure Mystery is Revealed!
Here is the experiment setup that produced this data and a sample video below. The final experiment data provided above were obtained by simply inflating a balloon until it popped and studying the change in pressure inside it over the duration of the experiment. Due to its small size we were able to collect data from inside the balloon using databot!
Procedure:
Perhaps the trickiest part is fitting databot into the air balloon. See the section in the video demonstrating how to do this. It is much easier if you work in a team to do it.
Ensure you’ve turned on databot before inserting it into the balloon as it is easier to find the switch, especially if the balloon is opaque. If forgotten, you can attempt to identify the switch by feel and turn it on while inside the balloon. If you can’t find it, remove databot, turn it on, and insert it again.
Launch the Vizey program, select Air Pressure experiment for initial pressure measurement.
Now inflate the balloon with your breath until it bursts.
After the balloon bursts, databot will fall to the floor. Take precautions to prevent it from breaking by laying down a pad or pillow to give it a soft landing!
More Details
Vizeey is such a versatile program that sharing the results of these experiments is simple. If you’d like to see how Vizeey works and explore these data sets, go to the app store and download Vizeey. One installed you scan these QR codes from inside the Vizeey app to view the outcomes. Below, are three experiments that you can explore. Enjoy!
1- Experiment
2- Experiment
3- Experiment
See the Experiment and Data in Action!!
About databot™
databot™ learning solutions transform the way K12 students experience data, science, and technology. In the classroom, after-school, and in the home, our mission is to make interacting with and understanding data a beautiful, fun, and ubiquitous experience. One that crosses the traditional boundaries of all learning environments.
The world is driven by data and we are driven to teach future generations how to use it for good. We create data powered technology and brilliant learning activities that empower students everywhere to think deeply, explore with passion, and solve our planetary scale challenges.
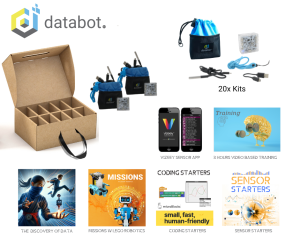
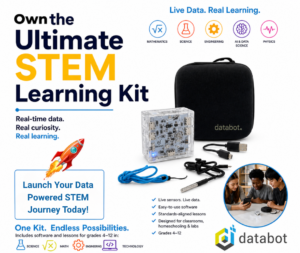
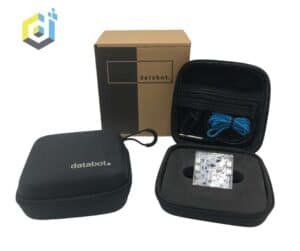
If you don’t have databot yet check out the options below and visit our store.
Learn about databot here Click on any product configuration for details!