Rolling Inside a Ball
Introduction
At databot, we love discovering new ways to make physics, data, and STEM learning come alive. One of our most exciting activities is placing databot inside a rolling ball to capture gyroscope data and analyze how it moves. This simple yet powerful setup turns motion into measurable data—perfect for hands-on experiments in the classroom or lab.
The gyroscope sensor inside databot measures angular velocity, or how fast the device rotates around its X, Y, and Z axes. By studying this data, students can explore rotational motion, stability, and impact. What happens when the ball rolls smoothly? How does the data change when it wobbles, spins, or collides with an obstacle? Each scenario reveals a new piece of the physics puzzle.
In this blog, we’ll uncover the science behind gyroscope data, learn how to visualize motion with graphs, and share creative ideas for STEM classroom investigations. Whether you teach physics, engineering, or data science, this activity connects real-world movement with digital analysis—making learning both fun and meaningful. Let’s roll into discovery!
What is a Gyroscope?
A gyroscope is a sensor that measures angular velocity—how fast an object is rotating around an axis. It works based on the principles of angular momentum, which means that a spinning object resists changes to its orientation. Gyroscopes are widely used in various technologies, from smartphones and drones to spacecraft and robotics.
How Does a Gyroscope Work?
A gyroscope detects rotation by measuring the rate of change in angular velocity (usually in degrees per second, °/s). It typically consists of a small vibrating structure that responds to changes in motion. When an object rotates, the Coriolis effect causes shifts in this structure, allowing the sensor to calculate rotational speed along three axes:
🔹 X-axis – Side-to-side rotation (tilting left or right)
🔹 Y-axis – Forward and backward tilt
🔹 Z-axis – Spinning motion (like a top)
To deepen your understanding of the gyroscope sensor, be sure to check out our detailed lesson available on the website.
https://databot.us.com/ss-gyroscope/
This powerful tool enables exciting experiments, such as rolling databot inside a ball, studying rotational forces, and analyzing movement stability across different surfaces. With the gyroscope in databot, we can explore the fascinating physics of motion in a hands-on, engaging way!

About databot™
databot™ learning solutions transform the way K12 students experience data, science, and technology. In the classroom, after-school, and in the home, our mission is to make interacting with and understanding data a beautiful, fun, and ubiquitous experience. One that crosses the traditional boundaries of all learning environments. The world is driven by data and we are driven to teach future generations how to use it for good. We create data powered technology and brilliant learning activities that empower students everywhere to think deeply, explore with passion, and solve our planetary scale challenges.
If you don’t have databot yet you can buy one here

Background
Understanding rotational motion through gyroscope data isn’t just an interesting classroom experiment—it has real-world applications in sports, engineering, and even robotics. By analyzing how an object rolls, spins, or wobbles, we can gain insights that impact equipment design, athletic performance, and even autonomous navigation systems.

✅ Golf – Improving Spin Control
In golf, the way a ball spins after impact directly affects its trajectory, distance, and how it behaves on the green. By using a gyroscope to measure the spin rate and axis of rotation, players and equipment designers can optimize club design and improve playing techniques to achieve more accurate shots.

✅ Soccer – Analyzing Curved Shots
When a soccer player kicks the ball with a curved trajectory (like a "banana shot"), the Magnus effect causes the ball to swerve. With gyroscopic data, coaches and players can see how different kicking techniques create spin. As a result, they can refine their skills for greater accuracy and control.

✅ Billiards – Perfecting Cue Ball Spin
In billiards, applying spin (or "English") to the cue ball can change how it interacts with other balls and the table. Gyroscope data could provide insights into how different stroke techniques affect spin and rebound angles. This helps players gain better control over their shots.

✅ Autonomous Robots – Navigating Uneven Surfaces
Robots that move using wheels or rolling mechanisms need to maintain balance and stability. By analyzing rolling motion in different conditions, engineers can refine robotic movement algorithms for better navigation on rough terrain.
Setting Up the databot Rolling Ball Experiment
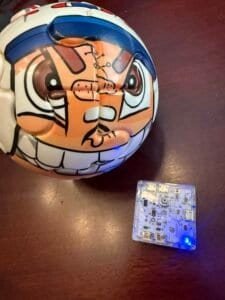
We have long dreamed of placing databot inside a ball to study its movement using a gyroscope. We were curious to see how it reacts to rotation, impacts, and different surfaces.
Gyroscopic data helps us explore the dynamics of motion—how smoothly the ball rolls, what forces act during collisions, and how quickly it changes direction.
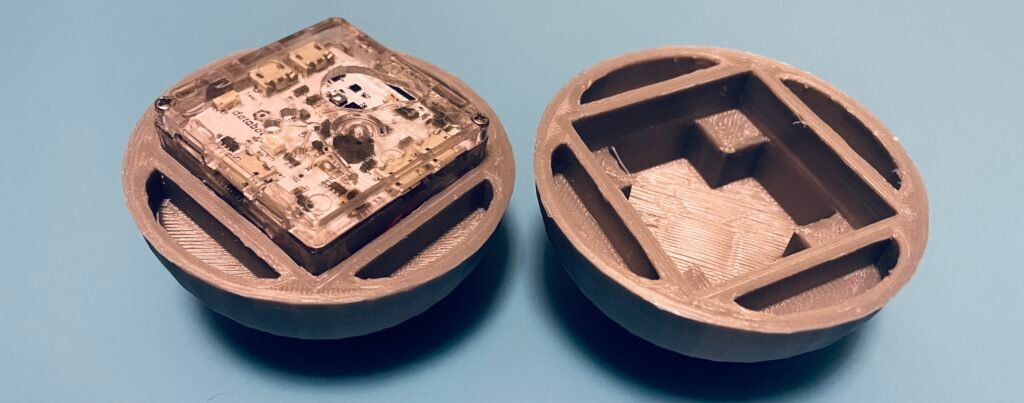
At first, we used a puzzle-style ball, but soon realized we needed a universal design so anyone could repeat the experiment easily. Therefore, we created a 3D-printable model—a custom housing for databot that fits securely inside a rolling sphere.
Now, you can try this experiment too! Explore how a ball moves using gyroscopic data and uncover new insights into rotational physics.

Vizeey app - Data Visualization Tool for Students
To work with databot, we will need the Vizeey app. With this program, we will be able to see the experiment’s results and measurements in real-time.
If you haven’t used the Vizeey program before, follow the link to download and set it up. There, you’ll find a detailed guide on installation and how the software works.
Capturing and Visualizing Motion Data
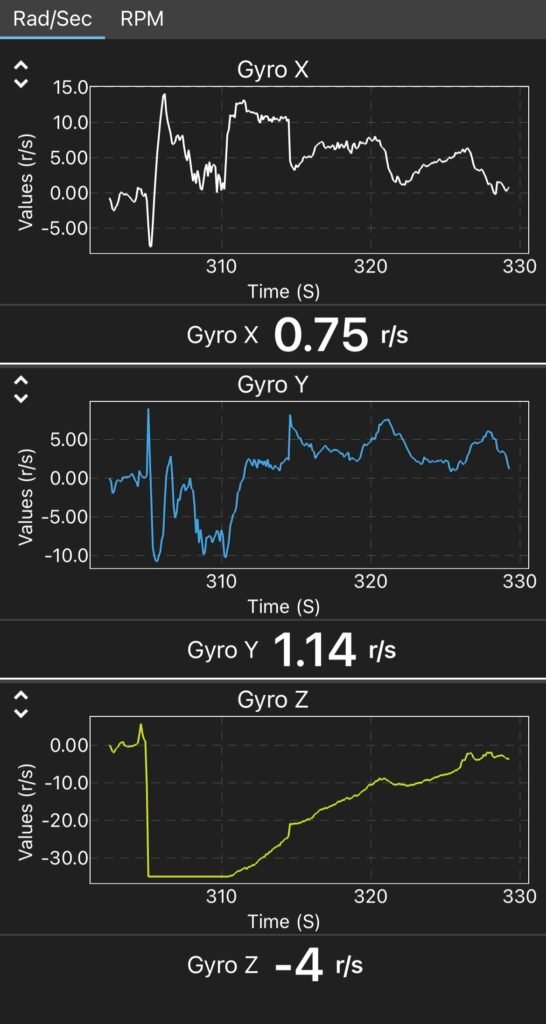
We placed the databot inside a sphere and conducted several experiments. At first glance, analyzing the data graphs can seem challenging. Each axis displays its own values—some moving in a positive direction, others in a negative one.
With a bit of practice, you can start to understand how each axis represents the ball’s rotation and the speed at which it spins. Let’s take a look at the experiments we conducted and decode some of the data graphs!

Experiment 1: Analyzing Ball Rotation Across Axes
The first experiment demonstrates how the ball rotates along different axes and records gyroscope data. The results reveal how the ball spins in both clockwise and counterclockwise directions:
🔹 Y-Axis Rotation – The ball tilts forward and backward, showing motion in both clockwise and counterclockwise directions.
🔹 X-Axis Rotation – The ball rolls side to side, displaying changes in direction along this axis.
🔹 Z-Axis Rotation – The ball spins like a top, indicating rotational movement around its vertical axis.
By analyzing these patterns, we can better understand the relationship between motion and gyroscopic data.

Experiment 2: Spinning the Ball
In this experiment, the ball was launched with a spin—a technique often used in sports to alter the trajectory of a moving ball.
🔹 Z-Axis Rotation – The graph shows a downward trend, indicating that the ball started spinning rapidly.
🔹 Spin Decay – As the ball gradually lost its spin, the data values on the graph moved back toward zero, showing how the rotation slowed over time.
Understanding spin dynamics can help in analyzing ball movement in sports like soccer, golf, and table tennis.

Experiment 3: Rolling the Ball in a Straight Line
In the third experiment, the ball was launched in a straight path without spin. The gyroscope data provides key insights into its motion:
🔹 Y-Axis Spike – A significant drop appears on the graph, representing the initial impulse when the ball was pushed.
🔹 X and Z-Axis Peaks – Two large spikes indicate the moments when the ball collided with an obstacle.
🔹 Final Motion – After the impact, the ball slowed down and eventually came to a stop, with gyroscope values returning near zero.
This experiment helps us visualize how forces act on a rolling object, revealing patterns in motion and collision dynamics.
Gyroscope Data Experiment in Action!!
Classroom Applications and STEM Learning Connections
Thanks to databot, we can transform complex rotational motion into clear visual graphs. As a result, these experiments make an engaging introduction to rotational dynamics, showing how objects behave when different forces act on them.
This is just the beginning of exploring the fascinating world of motion.
As we dive deeper into spinning, bouncing, and curved trajectories, we gain valuable insights into the physics of everyday life—from the spin of a soccer ball to the precision of modern engineering systems.
Furthermore, on our website you’ll find a collection of lessons and experiments designed to inspire curiosity and build understanding. Whether you’re a student, teacher, or science enthusiast, these hands-on activities offer fun ways to explore real-world physics through interactive data.
So, let the journey of discovery begin!


