TGR Foundation & databot Workshop: Beyond the Numbers

Introduction

We recently held an online workshop with the TGR Foundation that highlighted the use of AI tools in education.  The workshop was a lot of fun and included an awesome segment with Randy Kolset, the Technology Coordinator for Orange Unified School District, who highlighted a number of AI tools they are exploring and using within the district.  A grand finale highlight from Randy was a demonstration of Suno AI, in which he compiled audience feedback in to an awesome AI powered pop song.  

The workshop was moderated by Eric Moore, VP of Programs at TGR, who took a few minutes to introduce some of the remarkable TGR programs and resources that are available for educators, and recognized the support and funding from DoDSTEM for the DoDSTEM Ambassador program operated by TGR.   

The databot segment of the workshop focused on an AI assisted exploration of data sets using ChatGPT to help guide the inquiry process as we collectively tried to solve an air pressure data mystery.  The files and instructions for conducting this mystery follow.  You can watch/review the workshop at your leisure here:

Workshop Link:  Beyond the Numbers   Use Password: EW0L+k8T

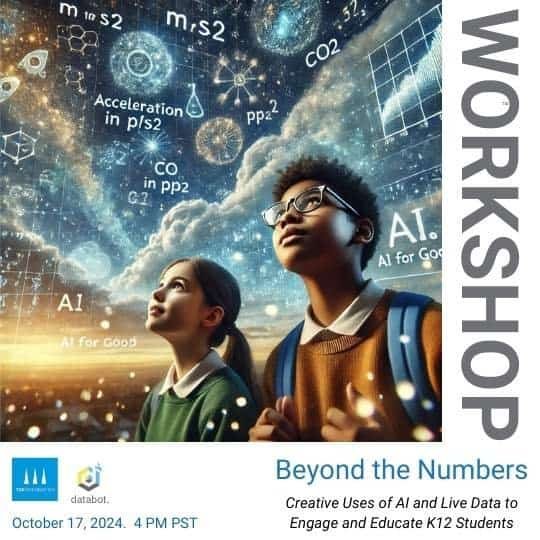
Poster with date for the TGR+databot workshop.

A Data Mystery: How to Conduct this Mystery in Your Classroom!

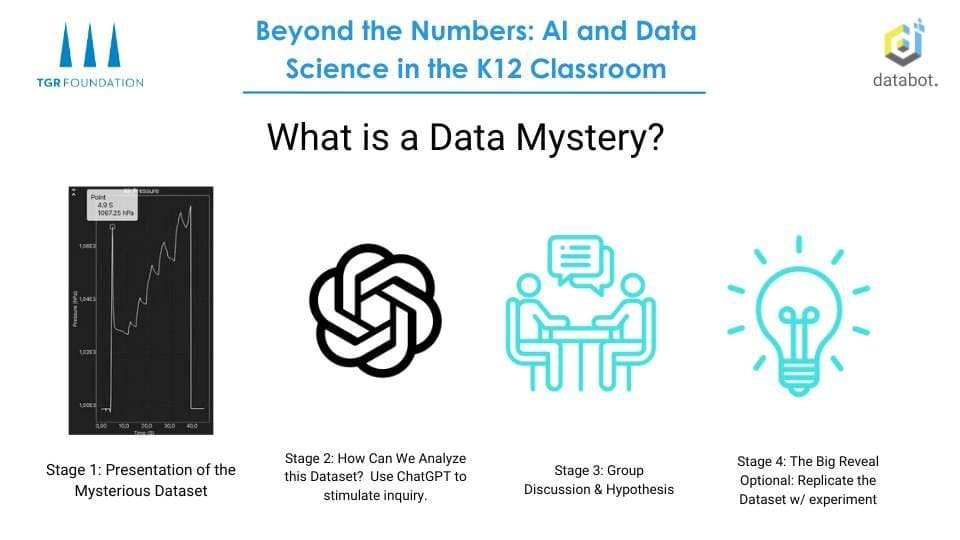
You can do this mystery in your own classroom using the supplied .CSV files linked below.  If you do not have access to an AI tool such as ChatGPT as illustrated in the workshop have no fear, you can guide the students through a mystery exploration simply by showing the graphs and the datasets and asking questions.   Here is the general process: 1) introduce the concept of the data mystery – a phenomenon of some kind is creating these changes in sensor readings; 2) Ask questions about how to analyze the data – where do we start?  If you have access to a tool like GPT it can be a great introduction to how to use AI tools for helping to solve problems; 3) Have students form groups to discuss and hypothesize what might be going on, ask them to present their best ideas and give their “final answer”to the mystery; 4) Do the Big Reveal!  If you have databots to replicate the experiment and produce the dataset have the student groups work together to do so.  The big finale is great fun.

A Data Mystery!

Atmospheric pressure is an invisible force that surrounds us every day, pressing upon us from all sides as the force of gravity exerts its pull on the Earth’s atmosphere. But did you know that air pressure significantly influences us and our lives? Air pressure impacts weather phenomena and can even impact your health.  For example, people might complain of joint pain when a storm is coming.  This is because a low pressure zone is associated with stormy weather, and a drop in air pressure allows our tissues to expand and apply pressure to our joints. If you have arthritis or sensitive joints, this can be quite painful.  Many other aspects of life are impacted by air pressure but we rarely think about it!

Today, we explore air pressure through a fun Data Mystery and challenge  your inquisitive mind to solve this puzzle with your wits!

Students in a classroom studying an image of data on a white board that poses a data mystery. They are thinking hard and trying to solve the mystery.

Solve this mystery through data analysis alone – what could cause this!?

Essence of the Air Pressure Experiment

The experiment is based on measuring changes in air pressure using databot during a specific activity.

CLUE: the phenomenon being represented is VERY COMMON.  Everyone has probably witnessed or actually done this at one time or another.

CLUE: The duration and interim steps of the experiment may vary significantly, however, the experiment consistently demonstrates an initial significant air pressure spike, followed by a rapid descent to a much lower initial value. Subsequently, the pressure gradually increases in increments. When the pressure nears or exceeds the initial peak value, it sharply returns to the original level.

CLUE: The initial air pressure level and the ending air pressure value are equal.

Data Mystery data sets that show fluctuations in air pressure.

CLUE: Ponder the different data sets.  The beginning and end are very similar for each set, but the interim data seems to vary wildly.  The time frame also ranges widely from 40 seconds to 100 seconds. Do you think this is an artificial (human-made) phenomenon or naturally occurring?

Download the Datasets for Exploration

Below are two datasets that you can download and load up in to the program of your choice – any spreadsheet (Numbers, Excel, Sheets) for example will enable you to generate the graphs as shown here.  You can also use CODAP, a remarkable, FREE tool for exploring datasets.

Click to Download this CSV
Google Sheets chart showing changes in Air Pressure from the data mystery.
Click to download the CSV.

Leading the Conversation with AI

ChatGPT Facilitates Inquiry

If you have watched the workshop you will have seen the example of how we implemented the use of the Voice Interface for ChatGPT to help lead the investigation of this mysterious data set.  You can use any of the existing tools that may be available in your school district if you are unable to use GPT.  For the TGR Workshop we used ChatGPT 4.o and used the voice interface for a fun demonstration.   The idea is to use these tools to stimulate inquiry and show a viable, real-world application for AI to your students.  The short video shown here is a quick example to give you an idea if you haven’t had time to watch the workshop.   NOTE:  It’s important to know that much of the information that can come back from your AI tools may not be accurate so you should always fact check, and encourage your students to do so as well!

The Air Pressure Mystery is Revealed!

Here is the experiment setup that produced this data and a sample video below.  If you have a databot it is a fun mystery to replicate so students can see how the dataset is actually created.  If you don’t have a databot watching the video is fun also.
The final experiment data provided above were obtained by simply inflating a balloon until it popped and studying the change in pressure inside it over the duration of the experiment. Due to its small size we were able to collect data from inside the balloon using databot! 

Procedure:

  1. Perhaps the trickiest part is fitting databot into the air balloon. See the section in the video demonstrating how to do this.  It is much easier if you work in a team to do it.
  2. Ensure you’ve turned on databot before inserting it into the balloon as it is easier to find the switch, especially if the balloon is opaque. If forgotten, you can attempt to identify the switch by feel and turn it on while inside the balloon.  If you can’t find it, remove databot, turn it on, and insert it again.
  3. Launch the Vizey program, select Air Pressure experiment for initial pressure measurement.
  4. Now inflate the balloon with your breath until it bursts.
  5. After the balloon bursts, databot will fall to the floor. Take precautions to prevent it from breaking by laying down a pad or pillow to give it a soft landing!

Engage students and capture their imagination with compelling phenomenon captured in data.  What do the numbers mean??!!

See the Experiment and Data in Action!!

More Details

Vizeey is such a versatile program that sharing the results of these experiments is simple.  If you’d like to see how Vizeey works and explore these data sets, go to the app store and download Vizeey.  One installed you scan these QR codes from inside the Vizeey app to view the outcomes. Below, are three experiments that you can explore. Enjoy!

1- Experiment
2- Experiment
3- Experiment

About databot™

databot™ learning solutions transform the way K12 students experience data, science, and technology.  In the classroom, after-school, and in the home, our mission is to make interacting with and understanding data a beautiful, fun, and ubiquitous experience. One that crosses the traditional boundaries of all learning environments.  The world is driven by data and we are driven to teach future generations how to use it for good.  We create data powered technology and brilliant learning activities that empower students everywhere to think deeply, explore with passion, and solve our planetary scale challenges. 

If you don’t have databot yet you can buy one here


databot