Illuminance is a physical quantity that defines the amount of light falling on a surface. It measures the intensity of the light flux distributed over a unit area. Formally, illuminance is defined as the ratio of the light flux striking a surface to the area of that surface.
Setting Up the Experiment
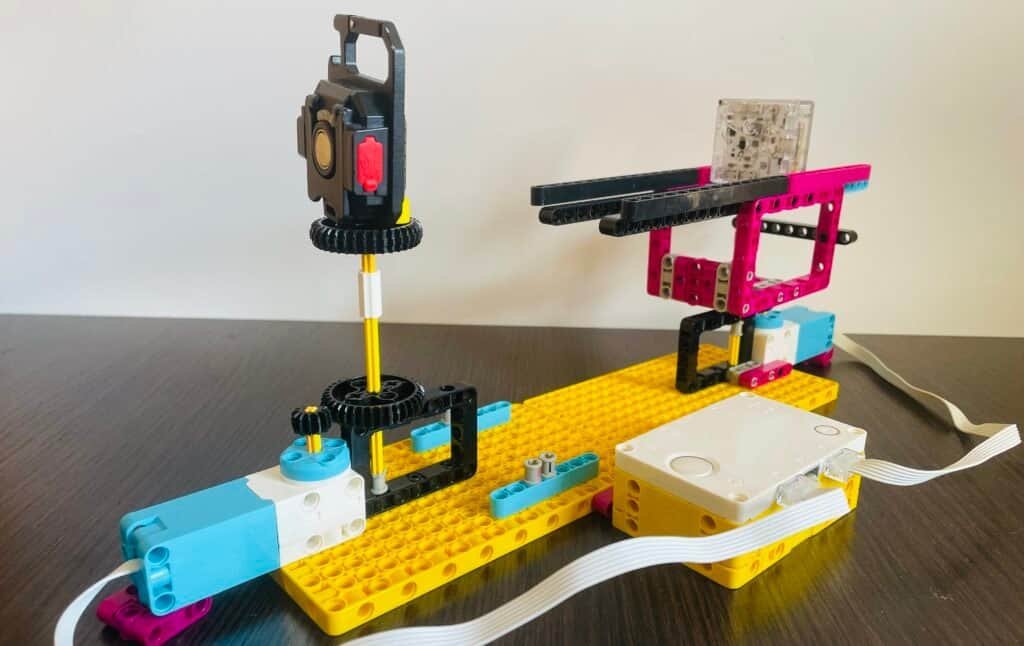
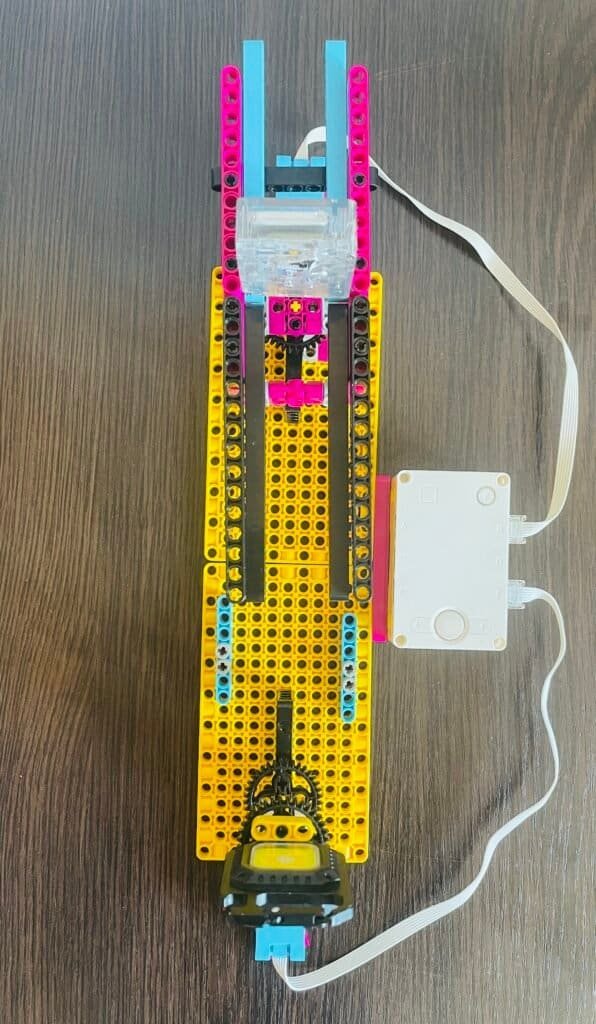
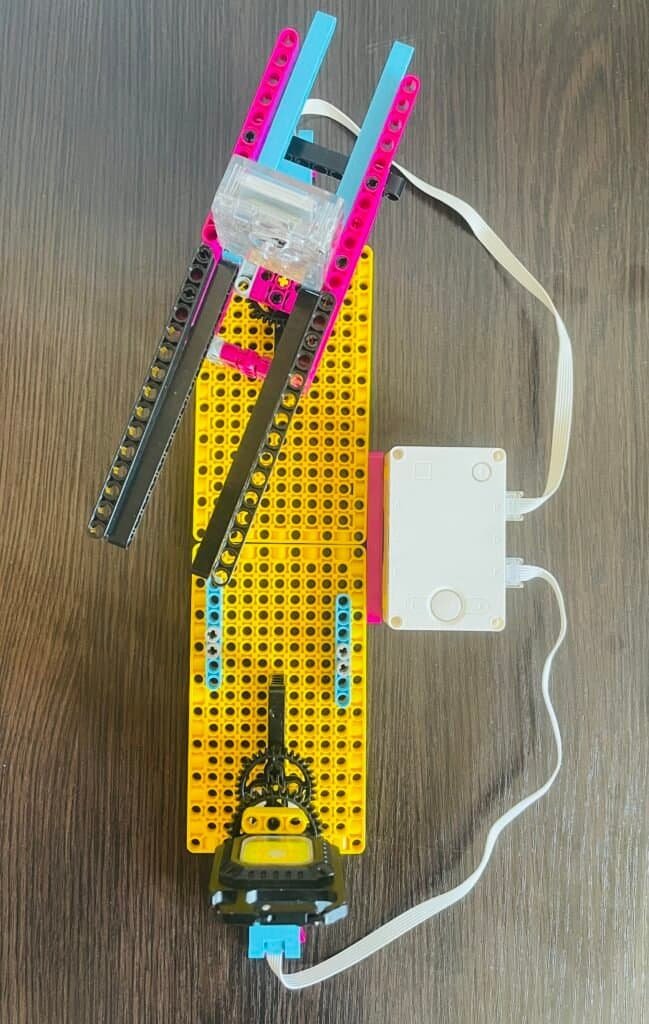
We will conduct a series of experiments that will fully explain the principle of illuminance in practice. I suggest we start with the experiments first, and then move on to the theory. For the experiment, we will need the LEGO® Spike Prime kit, a databot, and a light source (I’ll be using a flashlight). First, we need to build a model for the experiment using LEGO. You can download the build plans from the provided link.
Vizeey app
To work with databot, we will need the Vizeey app. With this program, we will be able to see the experiment’s results and measurements in real-time.
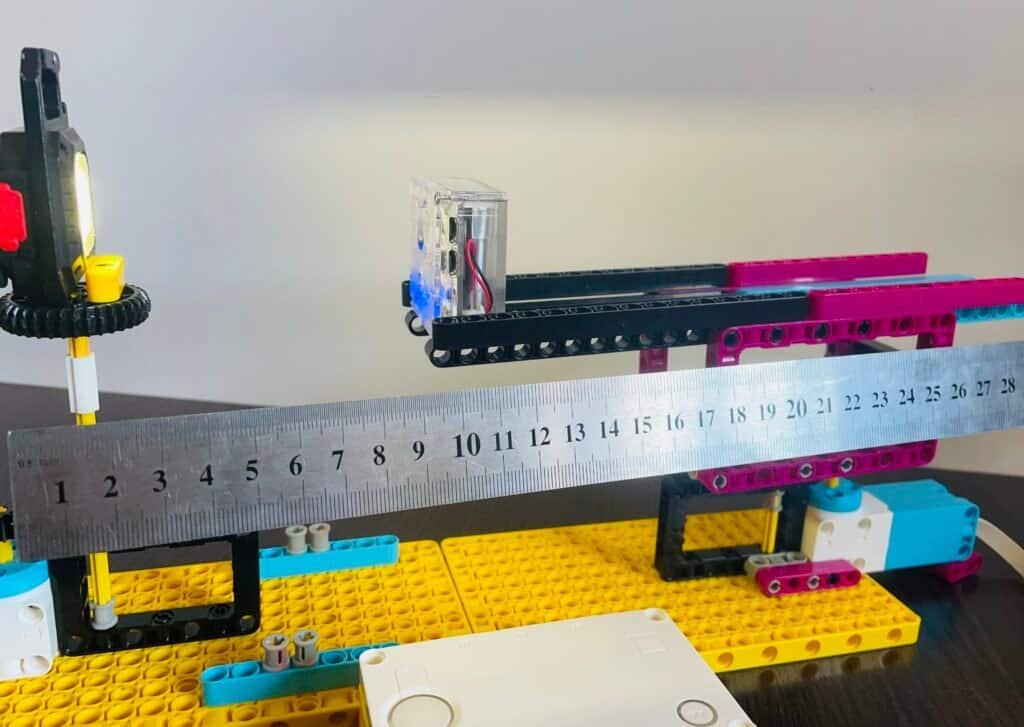
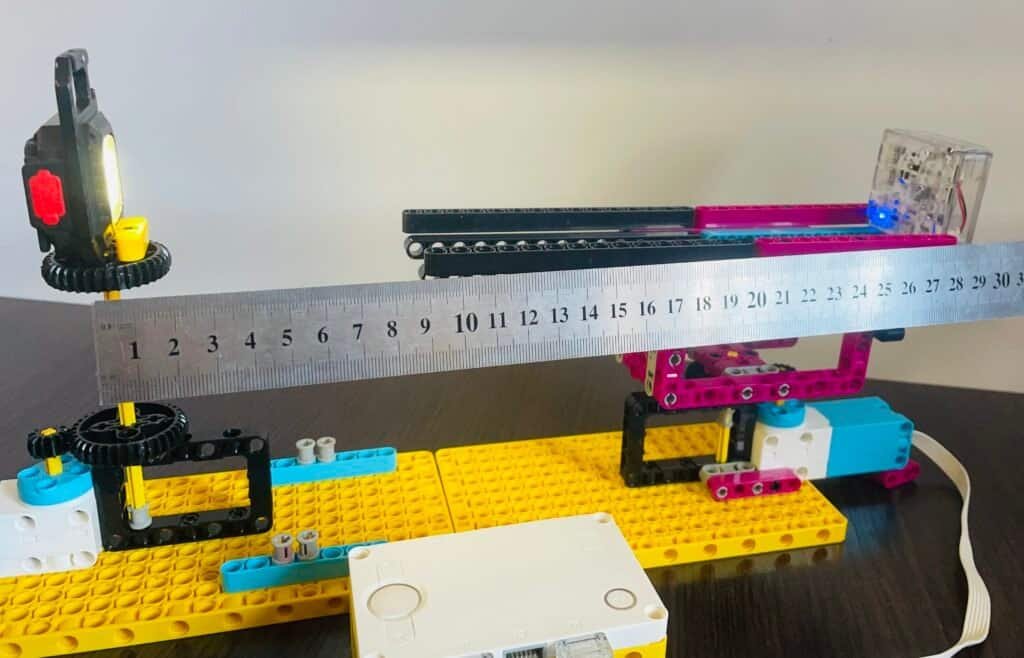
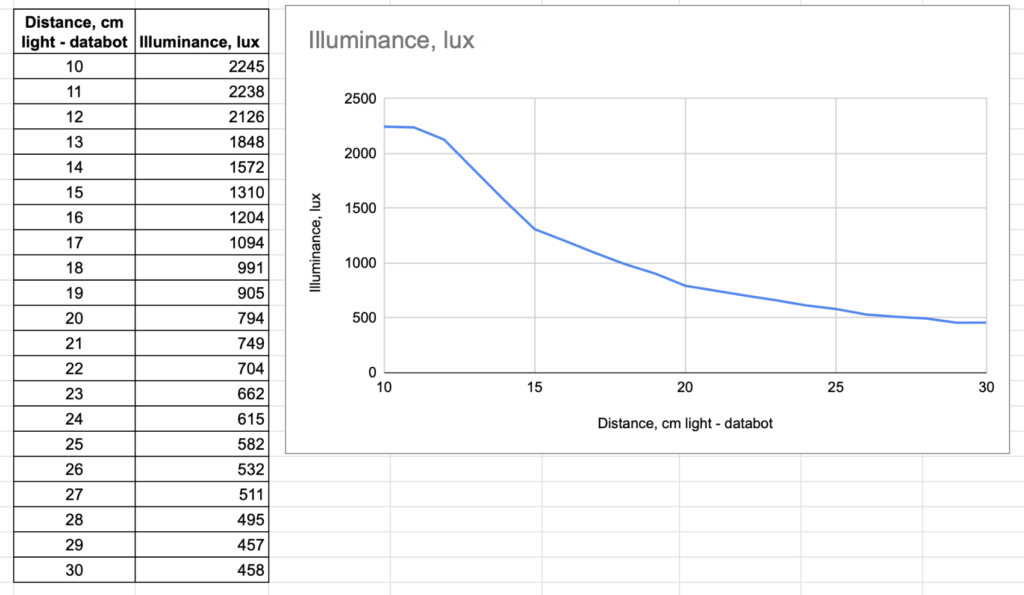
First, place databot and the light source on the pre-built platform. Then, measure the distance between the light source and databot. Open the Vizeey app and select the “Illuminance” experiment. You are now ready to measure the illuminance values. Try measuring at different positions: closest to the light source and farthest from it (move databot along the platform).
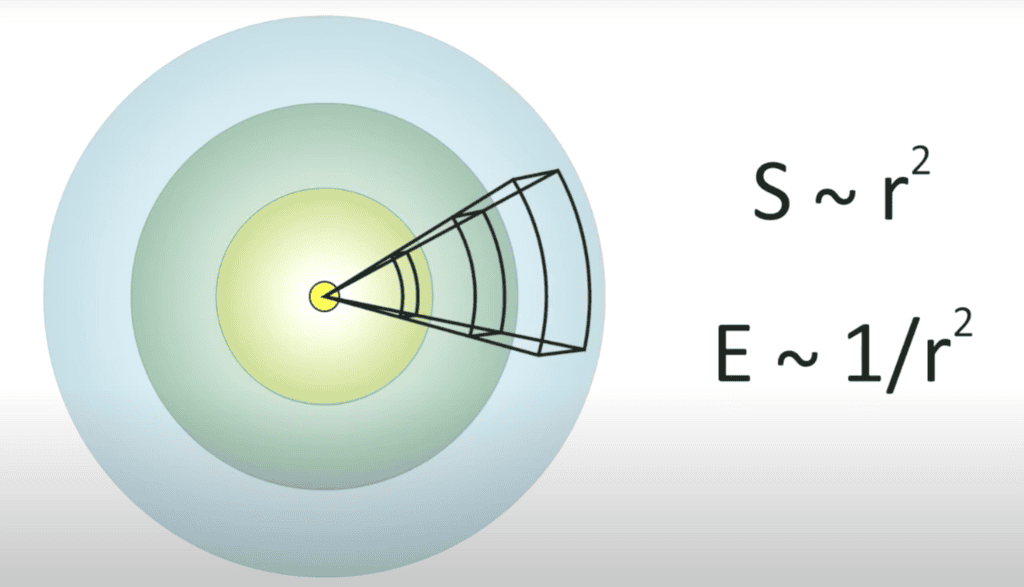
Analyze the recorded values and observe how the illuminance changes with distance. It is necessary to create a graph showing the relationship between illuminance and distance. The flashlight emits the same amount of energy, but the light flux disperses with distance. As databot moves farther from the light source, less light reaches it.
Experiment 2
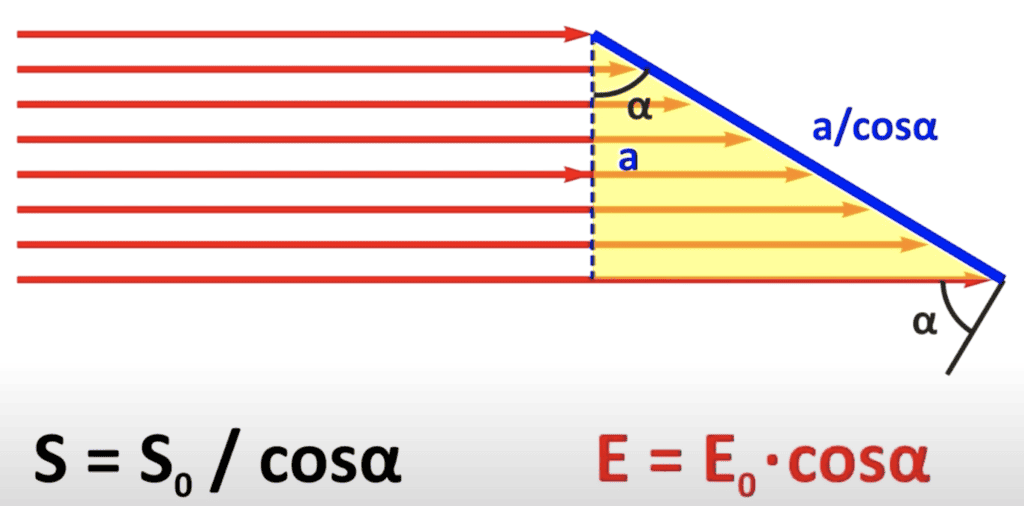
Let’s consider another parameter that affects the illuminance of a surface: the angle at which light strikes that surface. If we tilt the surface that the light is shining on, less light will reach it.
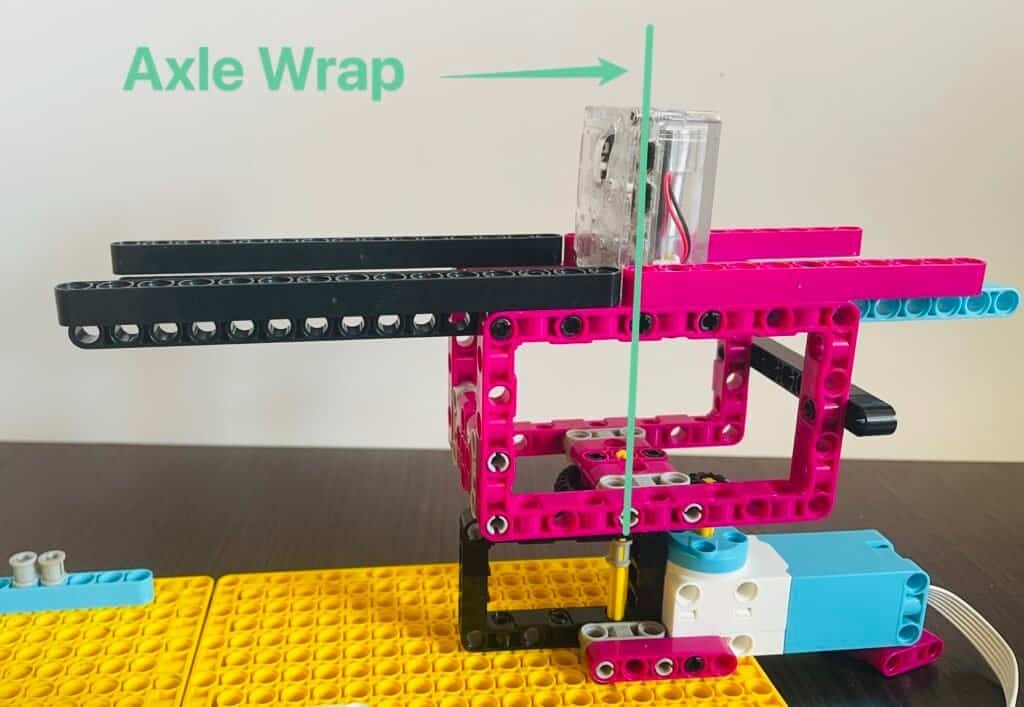
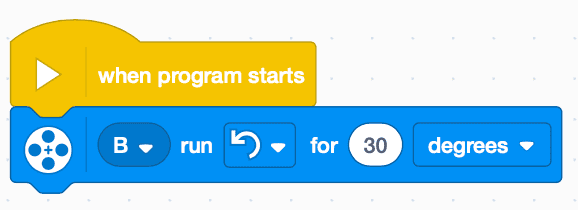
Place databot on the already built platform. The light source will remain stationary. Position databot on the platform along the axis of rotation. Now, using the Lego program, rotate the platform by 10 degrees. Observe how the light intensity values change.
Rotation 0 degrees
Rotation 10 degrees
The Lego construction is arranged in such a way that gears are used, allowing for more accurate angle of rotation adjustment. The gears are of different sizes, and they are treated as 1:3. This means that to rotate the platform by 10 degrees, the program must specify a rotation of 30 degrees.
The Solar System
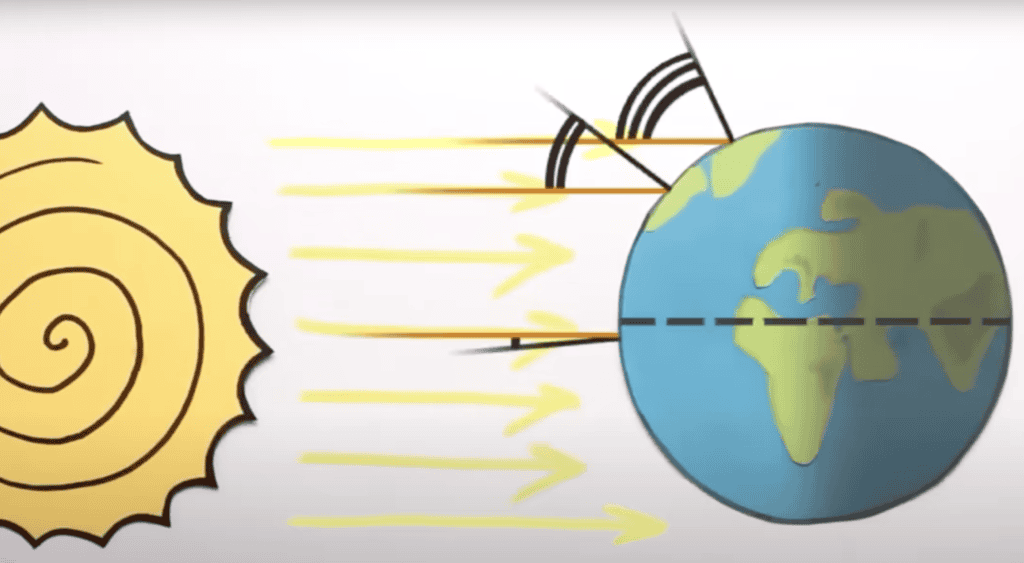
If we look at this model on a larger scale, it mirrors how sunlight strikes the Earth. Near the equator, the sun’s rays hit the Earth’s surface more directly, at a smaller angle, concentrating the energy over a smaller area. This results in higher temperatures. As we move toward the poles, the angle of the sun’s rays increases, spreading the same amount of energy over a larger area, which reduces the intensity of the sunlight and leads to cooler temperatures.
This phenomenon explains why tropical regions near the equator are much hotter, while regions closer to the poles experience colder climates. The angle of sunlight plays a crucial role in the distribution of heat on Earth, just as it affects the illuminance in our experiment.
What a candela is?
Did you know what a candela is? The candela is the unit of luminous intensity, which measures the strength of light emitted in a particular direction. The term “candela” comes from Latin and literally means “candle.”
Historically, one candela was defined as the amount of light produced by a single candle. Now, for comparison, consider a 100-watt incandescent light bulb. Its luminous intensity is approximately 100 times greater than that of a candle, meaning one such bulb can replace the light of 100 candles. Essentially, each watt of the bulb’s power produces about one candela of light.
The unit for measuring the total light output (luminous flux) is the lumen. One candela creates a luminous flux of 4π lumens, as it radiates light in all directions. For example, let’s take an LED bulb. The packaging typically lists the luminous flux it emits. If my LED bulb produces 800 lumens, we can calculate its luminous intensity:
800 lumens/4π steradians≈63.66 candelas
Lastly, a lux is the unit of illuminance, and 1 candela, at a distance of 1 meter, produces 1 lux of illuminance.