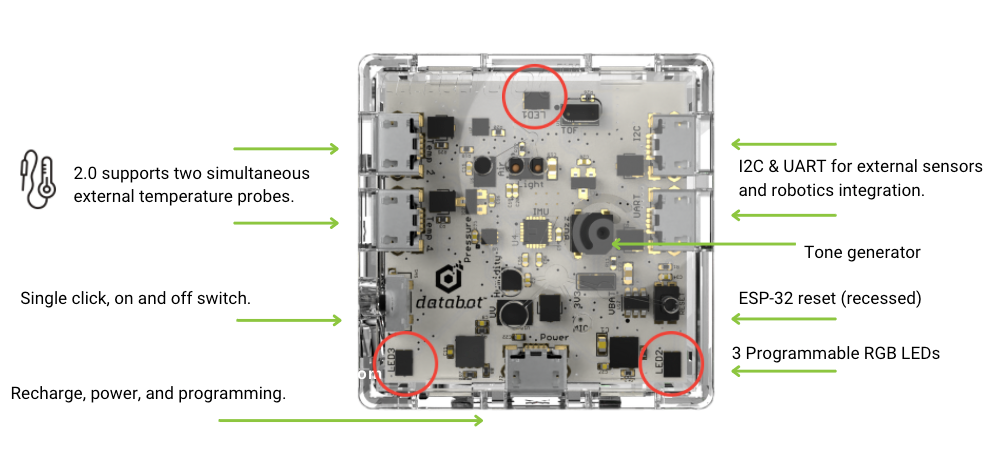
IOT dashboard for a greenhouse displaying humidity, soil and air temp, and ambient light levels.

Getting Started in IOT

In this detailed guide, we will cover how to turn your databot into an IOT device. We will go through all the connection steps together with you to create a cloud-based dashboard for monitoring environmental conditions in a greenhouse.  You’ll be able to monitor soil temperature, air temperature, humidity, and ambient temperature with one simple device (databot) and check all of these values from anywhere on the web – even from your smartphone.  Wow!

IOT dashboard for a greenhouse displaying humidity, soil and air temp, and ambient light levels.
Lush greenhouse and broadleaf plants

Introduction

IoT, or Internet of Things, is a concept related to a network of devices connected to the internet to share data and interact without direct human involvement.

The basic idea of IoT is that devices are equipped with sensors and are connected to a network that allows them to collect data, analyze it, make decisions and interact with other devices. 

There are many sensors in databot and with built in wi-fi capabilities it is a great tool to build IOT solutions. In this blog we will demonstrate how to connect  databot to a cloud-based IOT service (IO.Adafruit.com). This service will give us the ability to monitor and manage data in our smart greenhouse using awesome and easy-to-use visualization tools.  And the exciting part is that the data will be accessible from anywhere on our amazing planet!

What is MQTT?

There are many protocols used to transfer data on the Internet. One of them is the Message Queuing Telemetry Transport (MQTT) protocol, which is a publisher-subscriber based communication protocol designed to efficiently transfer messages between devices in bandwidth-constrained environments.
It was created to enable efficient data transfer and device management in the cloud and distributed systems such as the Internet of Things.
A simple flowchart of how MQTT works can be seen in the diagram below:

How Does It work?

The MQTT protocol works on a publisher-subscriber model. In traditional network communication, clients and servers communicate directly with each other. Clients request resources or data from the server, the server processes the request and returns a response. In the MQTT model we have a “middle-man” called the MQTT broker which receives the published data called “topics” from your device and holds this information until a user (you for example), retrieve the data.

Getting Started

You will need a databot,  2 temperature probes,  and access to the Internet to bring this project to life. You don’t need an actual greenhouse to do some testing, but if you have a planter you’d like to monitor that would be great!  If you don’t have a databot you can order one up here.

1.Let's sign up for the service Adafruit.com

The first thing to do is get set up with an IOT service that can manage your remote data.  For this example we will use Adafruit, an awesome service that offers free tools to get started.  Other systems such as Thingspeak will work just fine also as the MQTT protocol is standard.  To start with Adafruit, go to https://io.adafruit.com and register. This site will act as an MQTT broker and will store and display data for you when you access it on the web.

1. In the upper right corner, select Get Started for Free.

2. In the window that opens, fill in all the required fields and click on “Create account”.

3. After registering, you click on the “SIGN IN” button and enter your name and password.  

Congratulations!  You now have many opportunities to explore the world of IOT using Adafruit and databot!

4. Once logged in, you need to create a dashboard. To do this, click on the IO section (1), scroll to the dashboard section (2), and click on the “New Dashboard” button (3).

5. When creating a Dashboard, you enter a Name, Description and click the “Create” button.

If you want, you can also add a header image to make your dashboard more beautiful.


6. Once created, it will be displayed in the Dashboard list, and will be available for use.

7. Click on the “Greenhouse” name to get to the inside of our panel. At the moment nothing is displayed in it, because we haven’t added anything there yet.
To open the possibility of adding new items, click on the settings icon. 

8. Dashboards settings provide you some tools to build and customize your dashboard and tailor it to your particular tastes.   For now to keep it simple  just create a “new block” for displaying information from databot sensors.

Click on the “Create New Block” button.

9. There are many visual blocks that enable you to display your data in different ways. You can choose any of them and experiment with your dashboard look and feel.  

10. In the window that opens, enter the name of the new block and press “Enter” on the keyboard. This will create a new block. In this example,  a “temperature” block is created.

11. To further customize this newly created block select it with the “check mark”(1) and click on the “Next Step”(2) button.

12. In this final step,  give your block a title and see a preview of how it will look. Customize the look and feel of the block with the remaining settings. When you are ready, click the “Create Block” button to send it to your dashboard.

13. When the block is displayed on your Dashboards, you can leave it as it is, or customize it to your liking.
To do this, click on “Edit Layer”(1). Using “Block Corners” (2) you can resize it and you can also use “Gear” (3) to customize the block.

Congratulations! You have registered at io.adafruit.com and created your first dashboard. The next step will be to connect databot and prepare it for its task as an IOT device.

2. Connecting Databot

Meet databot

Databot™ is a low-cost, friendly, and engaging all-in-one sensor device that combines 15 internal sensors, 1 external temperature probe (supports two simultaneous probes),  Bluetooth low energy wireless, and Wi-Fi to provide a remarkably versatile educational tool for students from grades 4 and up. The sensors on board collect and report data on acceleration, air pressure, altitude, CO2, Color, angular velocity, magnetic fields, humidity, light, sound, temperature, ultraviolet light (index), and volatile organic compounds.  It is also capable of sensing proximity to objects within 2.5 meters and detecting gestures as you wave your hand back and forth over it.  Amazing!

Now to connect to databot you need the following things:

  • databot™ (Don’t have databot yet? Get yours here!)
  • USB Data Cable
Connecting databot to MicroBlocks

MicroBlocks is the coding environment used to program databot for this IOT project and it has all the tools necessary for creating a working IOT solution.
MicroBlocks is a drag and drop coding environment optimized for physical computing with microcontrollers. It makes working with databot sensors, lights, sound, and networking capabilities a snap! If you have not used MicroBlocks with databot yet, begin with the Getting Started guide.  Once you have set up for coding head on to the next step with your IOT project.

1. To connect databot to the IOT project being built on https://io.adafruit.com and display sensor data, ready to go code is provided in our MicroBlocks Gallery. You will only need to make a few changes to this program then upload the code to databot. Take a look at the picture below and you can download the code directly from this link if you’re ready to go.

  • In the wifi connect field you need to enter the name and password of the wifi network databot will be connecting to.
  • In the MQTT connect field enter the Username and Active Key from your Adafruit account. To get these details go to your Dashboards and click the “key” icon. 
  • The next step will be to connect the “MQTT pub” publish topic. 

  • It will be in this format:  (username)/f/(feed name)

  Do not forget to connect a temperature sensor to temperature probe port 1 on databot. It will be your first test sensor.

  • After making these changes to the MicroBlocks code you can update / upload the final program to databot. 
  • Run the program and test while connected to MicroBlocks and watch the “say” output to see if it is connecting to the MQQT service correctly.  If not, proof your code and recheck your Dashboard setup and values.

Now that you understand how the code is arranged and the program works you can expand your IOT solution. All of the other databot sensors are available and you can create Dashboards and display any information from them.  Try some experimenting, for example the display block “Line Chart” can not only display current information but also draw a history chart so you can see past data easily and observe any trends or patterns.

Now you can get creative!  Don’t stop –  test, experiment with data, evolve, explore databot and the other sensors. Go forth and explore!

Greenhouse Experiment Grand Finale!

Here is a final implementation of this Greenhouse experiment.
databot is successfully collecting and broadcasting data that enables the visual display if air temperature, ground temperature, humidity, and light intensity.
Here is the complete code for this project in MicroBlocks.  Enjoy, share and explore!

Link to code

IOT dashboard for a greenhouse displaying humidity, soil and air temp, and ambient light levels.