A recent article I came across had a brief summary of criteria for educators to use when evaluating products for purchase. One of those criteria (quoted here exactly) was “ability to “mix and match” and to be able to combine with other teaching resources e.g. LEGO® bricks …” Having long been champions of being able to pull legacy materials out of the closet and use them whenever possible, the databot™ design team planned for a lot of flexibility for use with other teaching resources.

A quick examination of the databot’s™ sleek underbelly will give you some immediate insight as you notice two rows of holes designed to accept LEGO® Technic pins, as well as two grooves designed to receive a standard fischertechnik® pin. An add-on smooth plate and Velcro is also included with the databot™ standard kit. The plate slides into the two fischertechnik® slots, enabling educators and hobbyists to also attach databot™ to just about anything that a Velcro patch will stick to.
If you’re not familiar with it, fischertechnik® is a popular building system in the STEM world, with students all over the world building cool things ranging from motorized tower cranes to simulated factory production lines to robotic explorers. The awesome thing about fischertechnik® is the advanced, “engineer-oriented” nature of the building system. A product line designed, lovingly curated, and expanded since 1964 by German engineers, fischertechnik® provides extraordinary flexibility for kids and adults alike to create awesome mechanisms. Given the recent highlight on the importance of databot™ working with other resources, I thought this might be a perfect example of how databot™ can help give new life and energy to materials you may already have on hand.
Some Assembly Required


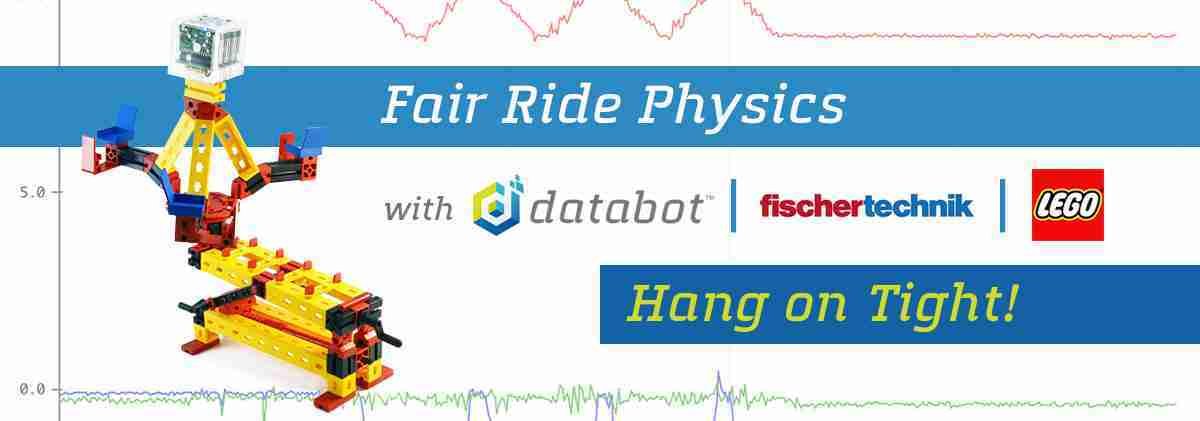
Here is a simple demonstration of using databot™ with fischertechnik® materials. First, we assembled the classic fischertechnik® “Tilt-a-Whirl” fair ride. You will note the model has two separate hand cranks, one operates the incline of the ride, the second operates the rotation of the ride – “tilt” and “whirl.” Second, I uploaded the simple accelerometer program to databot™ and mounted it on the ride’s incline axis as you see in the picture.
Visualizing Data
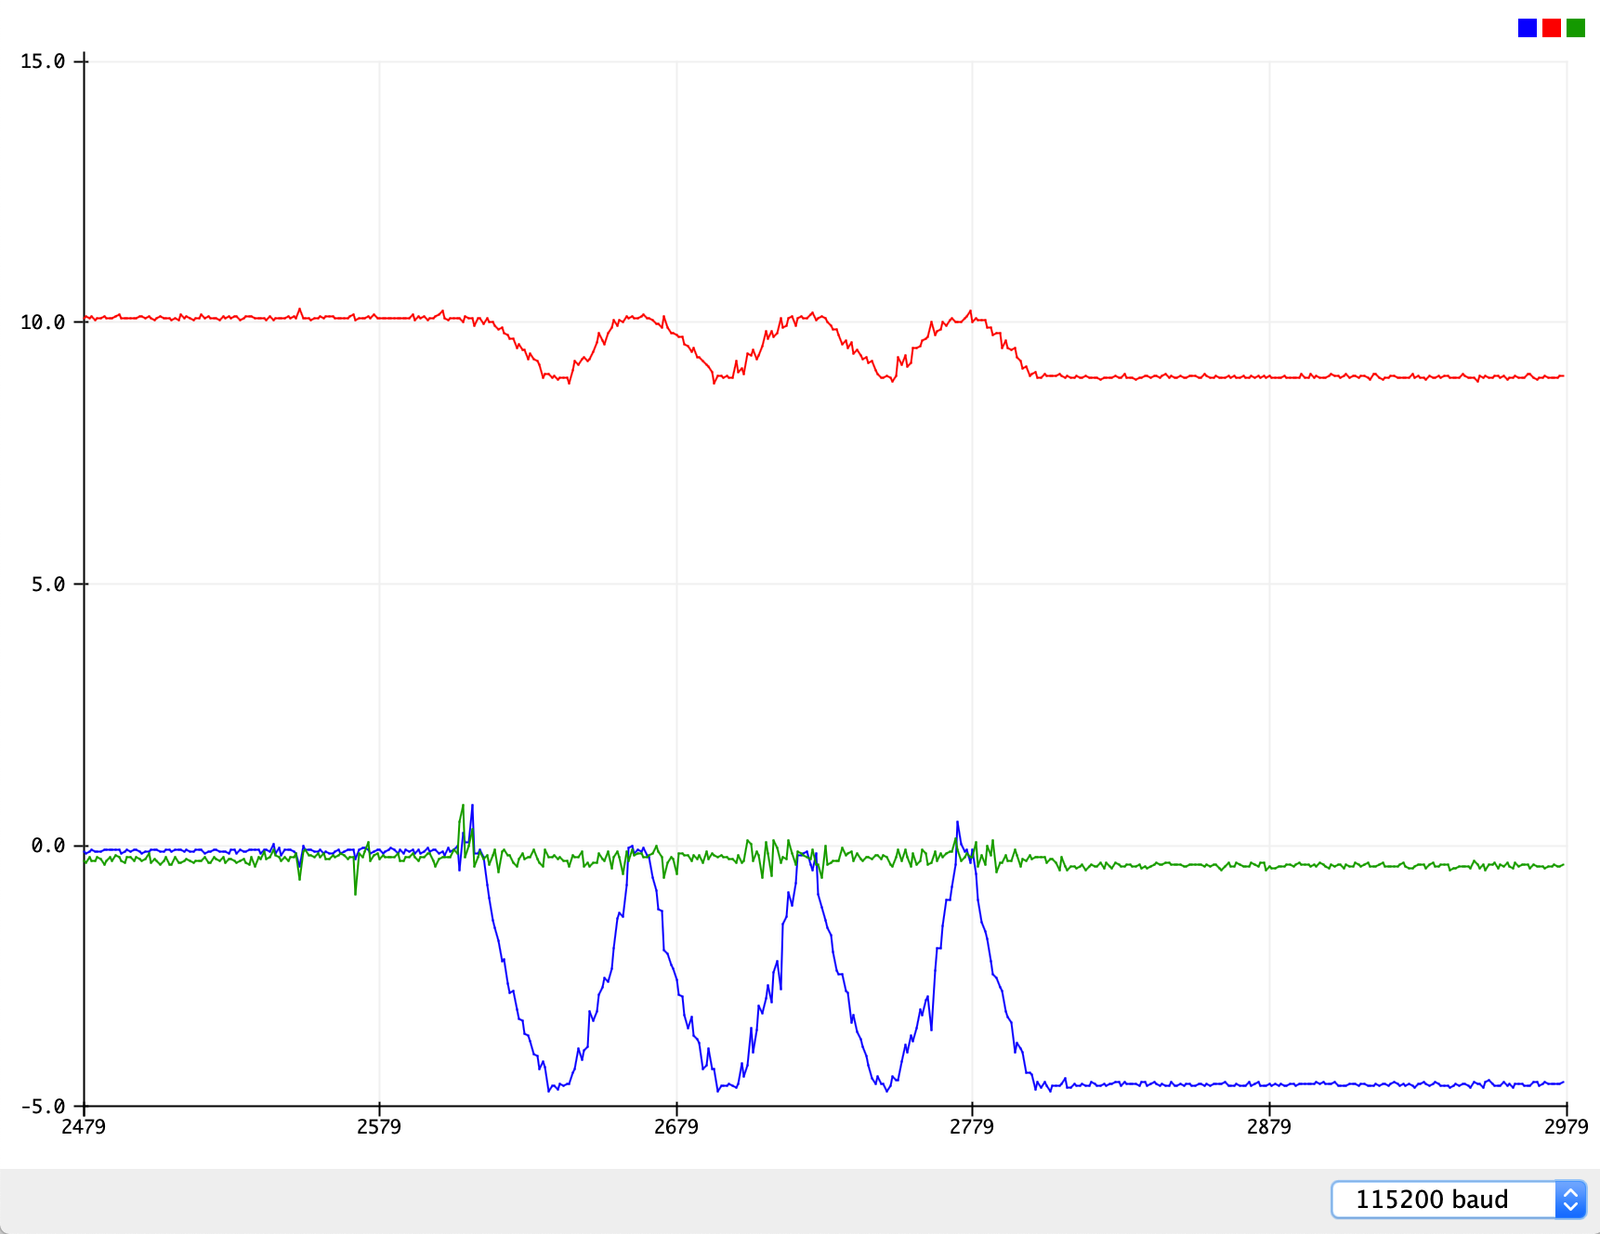
Next I started collecting data. You will notice the three values being reported by the accelerometer which is acceleration on each of databot’s™ three axes of motion. The data plot shown here shows three different actions
- databot™ at rest with the ride incline at zero degrees;
- a series of three events that shows me cranking the ride incline to its maximum angle then back down to zero; and then
- the incline set back to its maximum angle and left there.
Here are three quick challenges for your students with this demonstration. Note: the plotter is showing acceleration in m/s2 versus time in hundredths of seconds.
- Can you identify databot’s™ X, Y, and Z axes simply from this data plot as shown?
- When at rest and at zero incline, the data reading on one of the axes is close to 10 m/s2. Why is databot™ showing acceleration when it’s just sitting there at rest?
- Same question from a different angle (pun intended). When at maximum incline, but still at rest, two of the axes are showing acceleration. Why?
I’m looking forward to some further experimentation with databot™ and fischertechnik®, I think the next step will be to conduct some studies on rotation!

If you have some databot™ integrations with LEGO® or other systems to share, send them our way. Additional ideas for experiments and curriculum modules along these lines are welcome also. Send us your ideas by writing us on our website or social media!
About the Author
Robert Grover is a proponent of STEAM education and educational technology that helps engage and develop the students of today into the thoughtful leaders of tomorrow.